The reasons smaller companies have struggled go well beyond the rise of US mega-cap tech, according to fund managers.
Investing in mid-caps and smaller companies is supposed to mean taking on greater short-term risk for the prospects of much greater rewards over the long term. Yet over the past decade the latter half of that equation has been found wanting.
Most may be familiar with the outperformance of large-caps in the US, spearheaded by the Magnificent Seven, but America is far from the only market where the behemoths are outpacing the minnows.
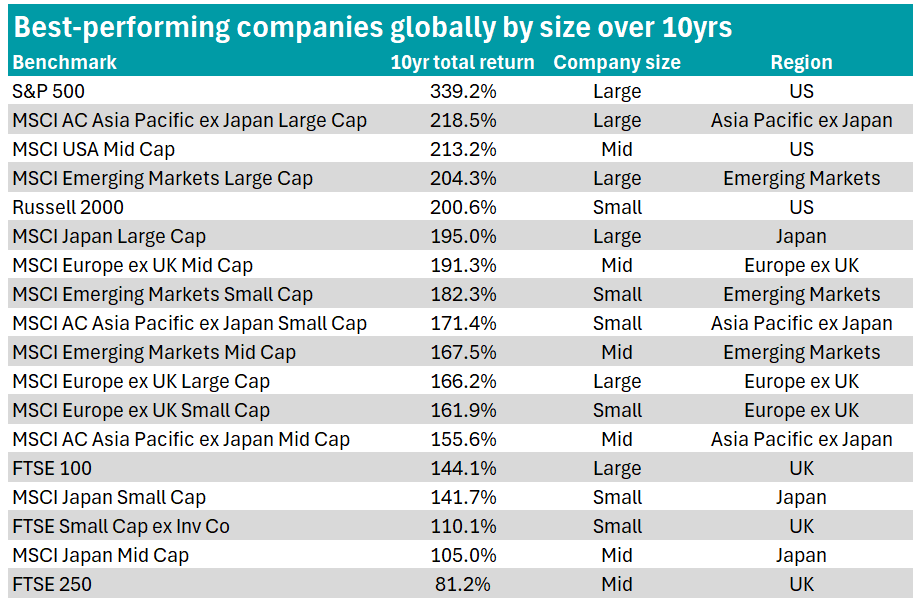
Trustnet analysed the 10-year total returns of 18 major global equity benchmarks to the end of May 2026.
As shown in the table below, in every single region bar Europe excluding UK, large-caps have outperformed their mid- and small-cap counterparts.
Source: FE Analytics
According to Richard Scope, manager of VT Tyndall Global Select, a major driver of this trend towards large-caps has been the shift towards passive investing, with US cap-weighted passive funds now accounting for 53% of all assets invested.
“The majority of assets invested in exchange-traded funds (ETFs) and passive funds are, by design, more weighted to large-caps, with many of the benchmarks that they are designed to mimic excluding small- and mid-caps, which exacerbates the issue,” he said.
In addition, Philip Matthews, manager of IFSL Wise Multi-Asset Income, said valuation expansion has been a “clear contributor to the success of large-caps, rather than fundamentally superior earnings growth”, with investors concentrating capital in a narrower group of large companies perceived to offer safety and structural growth.
Mark Ellis, chief executive officer and chief investment officer at Nutshell Asset Management, added: “The simple answer is that the past decade has disproportionately rewarded scale.
“Across most regions, the companies that have been able to compound earnings, defend margins, access capital cheaply and reinvest globally have tended to sit at the larger end of the market-capitalisation spectrum.”
He said it is less a story about size and more about quality, resilience and scalability being rewarded.
While these structural forces have supported larger companies across regions, several managers argued that the picture in the US is distorted by a narrow group of winners at the very top of the market – the mega-cap tech stocks also known as the Magnificent Seven.
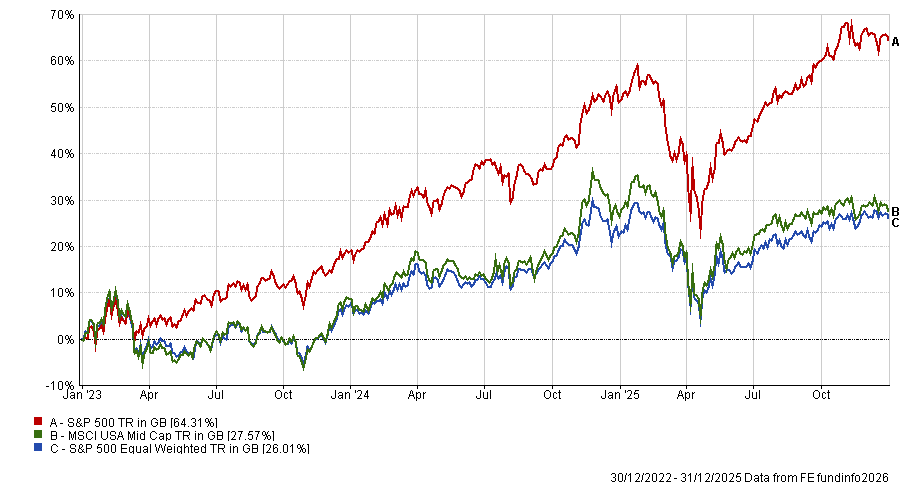
According to Sagar Thanki, co-manager of Guinness Global Quality Mid Cap, it is “not really a large-cap story at all, but a mega-cap one”, noting that the equal-weighted S&P 500 lagged the mega-cap-weighted index by almost the same margin as mid-caps between 2023 and 2025.
Performance of S&P 500 vs S&P 500 equal-weighted and MSCI USA Mid Cap, 2023 – 2025
Source: FE Analytics
Paul O’Neill, chief investment officer at Bentley Reid, said that although technology advancements propelled these seven companies higher and faster than anyone else, technology has had a farther-reaching impact on large-caps across the world as they “no longer have to adhere to physical borders, and data capture has enabled them to offer better, cheaper products and services to their client base”.
Justin Warton, portfolio manager at ECP Asset Management, agreed, noting that digital business models have increasingly “raised the upper bound of scale economies and allowed the largest companies in the world to continue to grow quickly, despite their size”.
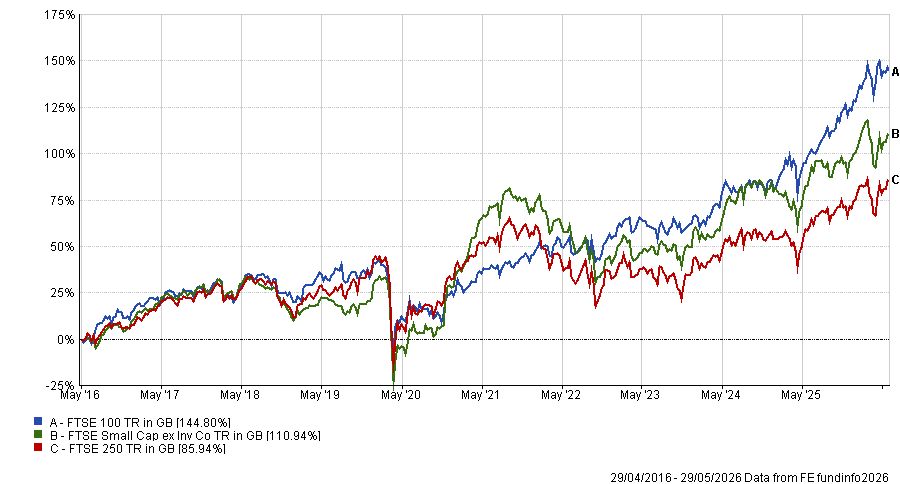
But technology is not the only driver of success, as the UK’s large-caps have also logged a similar pattern despite lacking a cohort of technology giants.
The FTSE 100 gained 144.1% over 10 years, while the FTSE Small Cap excluding Investment Companies index returned 110.1%. The FTSE 250 was the worst-performing index of all 18 assessed, gaining 81.2% over 10 years.
Performance of UK companies over 10yrs ending May 2026
Source: FE Analytics
Managers said UK large-caps have simply proven more resilient in a challenging landscape defined by Brexit uncertainty, political instability, weak capital flows into UK equities, higher interest rates, pressure on the consumer and a de-rating of UK-listed assets.
Ellis said: “Many FTSE 100 companies are global businesses earning revenues outside the UK, so they were less exposed to the domestic backdrop.”
While regional differences explain some of the dispersion, the challenges facing smaller companies themselves have also contributed to the widening gap.
Managers pointed to reduced research coverage and a tougher environment for lower-quality or more financially sensitive businesses as key headwinds for smaller companies.
O’Neill highlighted an additional structural shift for small-caps specifically, which is that many smaller companies are delaying listing.
“Smaller companies now have access to all sorts of capital outside of the equity markets,” he said. “That means they can stay private for longer and, when they do come to market, they are often mid- or even large-cap companies already – hence the reduction in the number of small-cap floated companies and therefore a reduced opportunity set.”
Even as the headline data would suggest a higher return is up for grabs when investing in large-caps, several managers argued that pressures on the small- and mid-sized market have created appealing opportunities.
Matthews said: “Historically, periods of extreme small-cap underperformance have often been followed by periods of strong relative returns.”
He added that many smaller companies now appear attractively valued in absolute terms relative to their own history.
Why the end of the Hormuz crisis could be the start of a multi-year structural opportunity in crude shipping.
The crude tanker market was not in balance going into the war in Iran. Over 20% of the global fleet of VLCCs (the massive super tankers that carry two million barrels of oil per voyage) was already 20 years old. This is an important threshold where maintenance costs rise, efficiency falls and regulatory pressure intensifies.
Environmental rules and the increased risk of spillages means that many oil companies refuse to charter them, forcing this cohort towards the margins and creating a significant shortfall of the vessels needed to carry oil around the world.
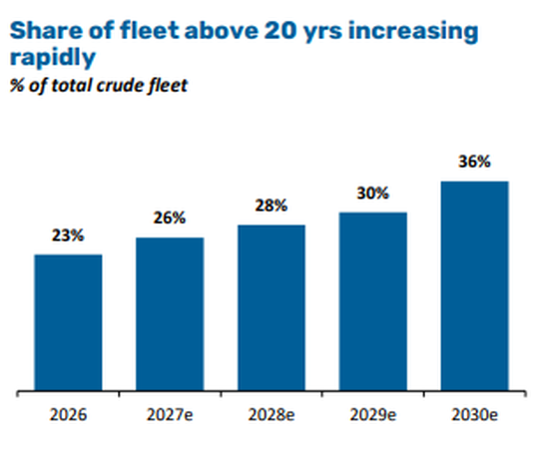
Source: Capital Tankers presentation.
The supply picture becomes even more complicated as many of these older vessels have drifted out of the mainstream market altogether. It is believed that over 20% of VLCCs now operate in the sanctioned or ‘shadow’ market – quietly moving Russian and Iranian crude to buyers.
These ships operate outside Western insurance frameworks and are effectively unavailable to conventional charterers. Even before the first shots were fired in the Middle East earlier this year, the headline supply already overstated the reality.
What happens when a tight market meets a shock?
The war in Iran and the closure of the Straits of Hormuz turned that underlying tightness into something much more extreme and serious. With roughly 20% of global oil flows normally passing through the strait, disruption had immediate consequences.
Cargoes stalled, vessels queued and insurers stepped back. Shipping rates surged as they typically do in such moments.
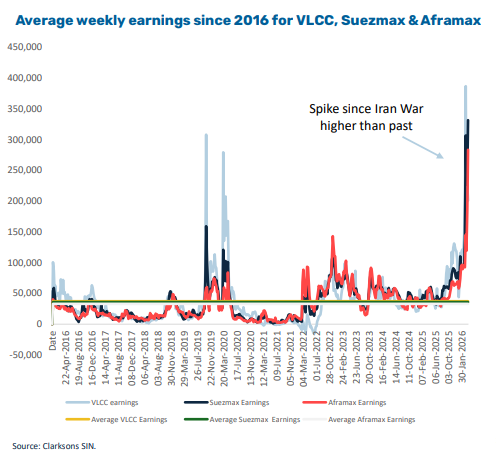
While these spikes rarely persist, they serve a useful reminder that the system that moves crucial energy supplies around the world is quite fragile.
The message is clear: spare capacity is limited and the system does not absorb shocks easily. Shipping markets tend to overshoot in both directions. Periods of calm breed complacency but periods of disruption expose what was already broken. The reopening of Hormuz is not the end of the story – it is the beginning of the next chapter.
Why the reopening is the real opportunity
It is tempting to view this as a short-lived event where rates spike initially, tensions ease and then markets normalise. We think that misses the point. The reopening of Hormuz is unlikely to reset the market to where it was before. Instead, it sets the stage for the next phase of the cycle, where several supportive dynamics begin to align.
First, there will be an immediate demand surge. Key importers, particularly across Asia, will have drawn down inventories and delayed cargoes, meaning strategic reserves released during the disruption will need to be rebuilt. When flows resume, this demand backlog does not usually return gradually – it tends to arrive all at once.
Next will come a permanent route rewiring. Relying on a single chokepoint for a significant portion of global energy supply has proven incredibly costly and the rational response must be to improve diversification through alternative sourcing, increased stockpiling and more complex routing. All of these require more shipping capacity per barrel moved.
Lastly, we will likely see structurally higher rates. Shipping is not just about how much oil moves, but how far. Longer routes, indirect flows and redundancy all increase effective demand for vessels, even if underlying volumes remain unchanged.
Insurance costs, chartering behaviour, and routing decisions rarely revert fully to pre-crisis norms – a degree of caution may linger and that caution has a price.
Is this just another cycle?
Shipping is often framed as a purely cyclical industry. That is broadly true but there are periods where structural factors take over. This increasingly looks like one of them.
On the supply side, the fleet is ageing and bifurcated. Older vessels face regulatory headwinds, while a sizeable chunk of capacity is tied up in non-compliant trades. Meanwhile, on the demand side, the system is becoming more complex. Energy security considerations are rising and supply chains are adjusting accordingly.
This points to a market where effective capacity remains constrained and utilisation stays higher for longer.
In this environment, the gap between ‘good’ and ‘bad’ assets widens. Modern, fuel-efficient vessels – particularly those aligned with tightening emissions standards – should see consistently stronger utilisation and pricing. They are the ships charterers prefer when optionality narrows.
By contrast, older tonnage faces a more uncertain future, while vessels operating in sanctioned markets remain largely excluded from mainstream demand.
This is not a rising tide lifting all boats; it is a more selective market where quality matters. The Norway-listed shipping company Capital Tankers offers a clear way to access this theme. Backed by Capital Maritime, the company is building a young, modern fleet with a focus on efficiency and compliance.
While the current fleet is relatively small, the delivery pipeline over the next few years materially scales the platform.
Crucially, much of this expansion has been secured ahead of the recent disruption. In effect, the company has locked in fleet growth at pre-tightening prices.
As those vessels deliver into what we see as a more supportive rate environment, the earnings potential changes significantly. What today looks like a modest base could evolve into a very different profile as utilisation and rates normalise at higher levels.
Mike Clements and Pras Jeyanandhan are managers of the VT Tyndall European Unconstrained fund.
Coller Capital’s Global Private Capital Barometer finds investors bracing for a rise in zombie funds while remaining broadly committed to private markets.
More than half of limited partners (LP) expect the number of private equity ‘zombie funds’ in their portfolios to rise, according to the latest edition of the Coller Capital Global Private Capital Barometer.
The barometer, which surveyed 108 LPs collectively overseeing more than $2trn in assets, found 54% of investors think their portfolio will hold more zombie funds over the next two years. A further 31% expect them to remain stable, while just 15% expect a decrease.
A zombie fund is where a general partner (GP) is prolonging a fund’s life in order to maximise management fees. This means an LP’s capital is locked in illiquid assets with limited returns.
“Private equity’s longer holding periods, plus the elevated entry valuations that some firms paid before interest rates rose, appear to be coming home to roost in investor portfolios,” Coller Capital said.
The survey found LPs hope to avoid confrontational solutions to the problem, with 54% of respondents saying the preferred response in no-fault situations is a management fee step-down. Manager incentive resets to encourage timely exits came second at 18%, while manager removal and taking no action were each favoured by 11%.
LPs’ preferred approach to no-fault zombie funds
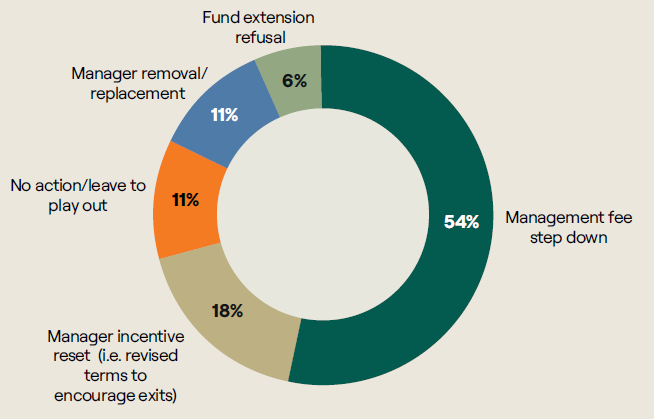
Source: Coller Capital Global Private Capital Barometer
The zombie fund concern sits within a broader trend of increasing selectivity. Almost a quarter (23%) of LPs plan to reduce the number of GP relationships across their private markets portfolios over the next three years, up from 16% when Coller Capital last asked the question in 2020.
Despite this, LP commitment to private markets remains resilient, with a third expecting to accelerate their rate of commitments, while 57% expect their pace to remain the same over the next two years.
Geopolitics is also becoming a more significant input into allocation decisions. Just over a third (37%) of surveyed LPs said the geopolitical environment and outlook are influencing their private markets allocations more than in the past.
The effect is more pronounced outside North America, with nearly half of European (46%) and Asia-Pacific (47%) investors citing greater geopolitical influence on their decisions.
Against that backdrop, continuation vehicles appear to have become an established feature of private markets rather than a temporary response to subdued exit conditions. GP-led secondary volume reached approximately $106bn in 2025, a record level achieved even as broader exit activity remained constrained.
Some 40% of LPs expect new continuation vehicle activity to continue increasing even when traditional exit channels improve. A further 29% expect it to remain at current levels, while 31% expect it to decline.
Jeremy Coller, chief investment officer and managing partner of Coller Capital, said: "Recent high-profile public market moves have put the exit window back at the centre of the conversation. That is encouraging, but it would be wrong to see IPOs and secondaries as competing routes to liquidity. The barometer makes it clear that they are complementary.
“Secondaries have become a core route to liquidity and a central part of how LPs allocate, rebalance portfolios and retain exposure to assets they continue to have conviction in. Two-fifths of LPs in this barometer expect continuation vehicle activity to keep growing even as traditional exits recover, which tells you something about how structural this shift to secondaries has become."
LPs rank private credit as the asset class most likely to see the greatest proportional secondary market growth over the next three years, at 36%, ahead of private equity, infrastructure and venture capital. This points to a shift in how investors may seek exposure to the asset class, with greater emphasis on seasoned assets, portfolio rebalancing and active liquidity management.
After several years of rapid expansion, private credit allocation intentions have cooled. The proportion of LPs planning to increase their target allocation to private debt or credit over the next 12 months fell from 42% in the previous barometer to 29% in this edition.
But only 18% of LPs believe there is a systemic problem in private credit, while 53% see isolated risk above initial expectations and 29% are comfortable that risk is in line with expectations.
Respondents are not aligned on whether GPs are striking the right balance between providing liquidity and allowing portfolio companies more time for value creation. While 40% believe GPs are generally getting the balance right, 39% say GPs are not providing liquidity early enough and 22% say some of the best companies are being sold too early.
LPs expect artificial intelligence to reshape private markets operations but do not yet see it primarily as a source of alpha. Some 70% expect GPs to use AI mainly as a cost-efficiency tool over the next five years. Just 22% see it as a driver of return outperformance and 8% see it primarily as a risk-management tool.
Two-thirds believe AI adoption by GPs will widen return dispersion between stronger and weaker performers. Among LPs making fund and co-investment decisions, 61% said the importance of gut instinct has not changed while 22% said it is increasing.
Investors await clarity on the next government's economic direction.
Keir Starmer resigned as prime minister and Labour leader this morning, triggering a leadership transition that analysts said will do little to resolve the underlying pressures on UK assets.
Andy Burnham, who won the Makerfield by-election last week, is expected to succeed Starmer, although there are questions as to whether it will be through a full leadership contest or if the former mayor of Manchester will win without competition.
Either way, when the next prime minister is confirmed, Britain will have had seven in roughly a decade – a level of political churn that is weighing on investor confidence, according to Susannah Streeter, chief investment strategist at Wealth Club.
The pound has been volatile, while 10-year gilt yields are hovering around 4.84%, sharply above those of international peers, despite slipping below the peaks reached during the most intense phase of the Iran conflict.
“Investing in UK assets continues to carry a risk premium given the bouts of political instability seen since Brexit, and there is little sign of that easing,” Streeter said.
Richard Carter, head of fixed interest research at Quilter Cheviot, said markets would prefer a proper leadership contest over an uncontested handover.
“Markets are wary of Burnham's previous policy positions so they would prefer to see ideas for governing fleshed out via a leadership contest, keeping surprises to a minimum,” he said. “There are difficult decisions around welfare and defence spending lurking, with each likely to have an impact on gilts and wider UK markets.”
Exactly what Burnham would do in Downing Street remains vague, but last week experts looked at the signs on Trustnet.
Whoever the new prime minister might be, public borrowing figures underline the scale of what awaits them, said Carter. Without a fresh mandate, he expects more tinkering with personal taxation rather than any structural fix – a prospect he said would weigh on growth.
Charlotte Kennedy, chartered financial planner at Rathbones, said a new prime minister would change investors’ finances very little immediately.
However, “political upheaval can create uncertainty that affects markets, confidence and expectations,” she said. “Whoever ultimately takes power will inherit the same difficult fiscal backdrop and quickly discover there are no easy wins.”
Kennedy said concerns about a potential wealth tax have already begun to affect behaviour among high earners. Rathbones' analysis suggests as much as £100bn of wealth could leave the UK or be redirected into less productive assets if such a levy were introduced, with some professionals already reviewing options to relocate to more tax-efficient jurisdictions.
John Wyn Evans, head of market analysis at Rathbones, said the initial market reaction had been muted. Gilt yields and sterling have moved broadly in line with global trends rather than responding sharply to domestic politics, a sign that investors are focused on fiscal credibility rather than political identity.
“While a Burnham-led government would likely shift policy leftwards, there are clear constraints,” he said. “The UK's fiscal position remains tight and recent experience has reinforced just how quickly bond markets can respond to perceived policy missteps.”
Both Rathbones analysts cautioned against reacting to the political noise. “We've seen before that pre-emptive decisions based on political noise can be costly,” Wyn Evans said.
Trustnet looks at the average discounts and premiums across the trust universe.
Property and private equity trusts are exceedingly good value if their own long-term history is anything to go by, while global trusts and debt instruments are relatively poor value.
In this series, Trustnet is looking at the share price discounts to net asset value (NAV) of investment trusts today relative to their five-year average. Having previously looked at UK specialists, here we compare the average of IT sectors. Readers should note that all discount data is correct to the end of May.
Real estate investment trusts represent broadly good value, but those in the Property - UK Residential are truly cheap, data from the Association of Investment Companies shows.
Historically these trusts have traded around par but today investors can pick up shares at an average 37.4% discount.
The sector difference has largely been skewed by Home REIT, which dropped 78.8% in April as the former homeless accommodation provider returned from a 39-month share suspension incurred after research suggested the trust had overvalued its properties and income.
The real estate investment trust also remains the subject of a fraud investigation by police and a regulatory probe by the Financial Conduct Authority.
Despite the average widening, the largest trust in the peer group – Social Housing REIT – has actually narrowed.
The only other trust above £100m market capitalisation is Residential Secure Income REIT. This trust has become cheaper, with its share price discount of 38.1%, some 11 percentage points below its five-year average.
The peer group is joined on the heavily discounted list by Property - Debt and Property - Europe, where the average trust discount has widened from 10.7% and 25.1% respectively to 15.7% and 30.8%.
| The most expensive IT sectors relative to their own history | |||
| Trust | Discount at end of May | 5-year average discount | Difference |
| Growth Capital | 13.7% | -28.8% | 42.6% |
| Leasing | -21.7% | -30.1% | 8.4% |
| Global | -0.2% | -7.8% | 7.7% |
| Global Smaller Companies | -7.8% | -14.0% | 6.3% |
| Global Emerging Markets | -3.5% | -8.6% | 5.1% |
| Debt - Structured Finance | -2.3% | -7.4% | 5.1% |
Source: AIC, Morningstar. Data correct as of 31/05/2026.
In second place, the next-most attractive peer group is IT Private Equity, where trusts are trading on a share price discount of 25.9% having historically been on a 5.3% premium over the past five years.
This has been almost entirely impacted by 3i Group, however, the largest investment trust in the world. The £31bn trust is so large it can mov the entire sector's discounts on its own, as has been the case this time around. It has shifted from a five-year average premium of 19.6% to a discount of 25.3%.
Much relies on the trust's largest holding: Action, which makes up almost three-quarters of the trust. The trust plummeted when it warned Action's sales growth was weakening in France, its premier market.
Rounding out the group is the IT Renewable Energy Infrastructure sector, where the average discount has doubled from an average of 14% to today's 29.3%.
Among the sector's largest trusts, Aquila European Renewables has widened the most, with its 18.8% average discount growing to 61.4% by the end of last month.
However it is not the only one. All of the sector's 14 trusts with a market capitalisation of £100m or more are cheaper than their average, including the £4bn Greencoat UK Wind trust and £2.7bn Renewables Infrastructure Group.
While these peer groups are cheaper on average then their medium-term history, most investment trust sectors have narrowed in recent months. Now, only 11 peer groups are wider than their five-year average, compared with 25 that were narrower.
| The cheapest IT sectors relative to their own history | |||
| Trust | Discount at end of May | 5-year average discount | Difference |
| Property - UK Residential | -37.4% | -2.0% | -35.4% |
| Private Equity | -25.9% | 5.3% | -31.1% |
| Renewable Energy Infrastructure | -29.3% | -14.0% | -15.3% |
| Property - Europe | -30.8% | -25.1% | -5.7% |
| Property - Debt | -15.7% | -10.7% | -5.0% |
Source: AIC, Morningstar. Data correct as of 31/05/2026.
IT Growth Capital trusts have been the biggest winners, with the sector moving from an average five-year discount of 28.8% to a premium of 13.8%.
The big winner has been Seraphim Space Investment Trust, which has jumped from a 30.5% average discount to a 75.7% premium at the end of May.
It has benefited significantly from the launch of SpaceX (a, which enjoyed a strong start to life on the market last week). The Elon Musk-owned tech company has revitalised the space investing sphere and Seraphim has been recommended by some as a diversified way to play the asset class.
Performance has been so strong that it entered the FTSE 250 earlier this month.
IT Leasing is in second place, although the trusts remain heavily discounted. Over five years, investors could pick them up for 30.1% below their net asset value. Today that figure is 21.7%, around 8.5 percentage points difference.
IT Global and IT Global Smaller Companies come next with both coming in around 7 percentage points. The former has moved to around par while the latter has halved its discount. IT Global Emerging Markets trusts were next moving from an average discount of 8.6% to 3.5% at the end of May.
Brunner's Julian Bishop on why the trust sits between two ideological extremes.
The artificial intelligence rally has made many fund managers uneasy, but none more so than Julian Bishop, manager of the £637.8m Allianz Brunner Investment Trust, who is now weighing what to do with his AI exposure.
Bishop has held positions in Taiwan Semiconductor Manufacturing Company (TSMC) and ASML through the rally, watching them become exceptional contributors to performance. But that success has made him question himself.
“We are already underweight tech and we're mindful that this is a big technological revolution – we want to participate in the boom. But we're students of history. We've seen the railroad boom of 1873, 1929, the dot-com bubble, the housing crisis. We've seen frenzies before,” he said.
He did not call AI a bubble but was wary of what happens to those who did: “If you called bubble two years ago and everything keeps going up, people become embarrassed. Actually, the relatively late stage of a bubble is when the detractors are sucked in. They say ‘I was wrong’ and they buy in – and then it goes wrong.”
Below, Bishop explains the philosophy behind the trust, where he is finding value today and what it would take for him to pull the trigger on his most profitable holdings.
Performance of fund against sector and benchmark over 5yrs 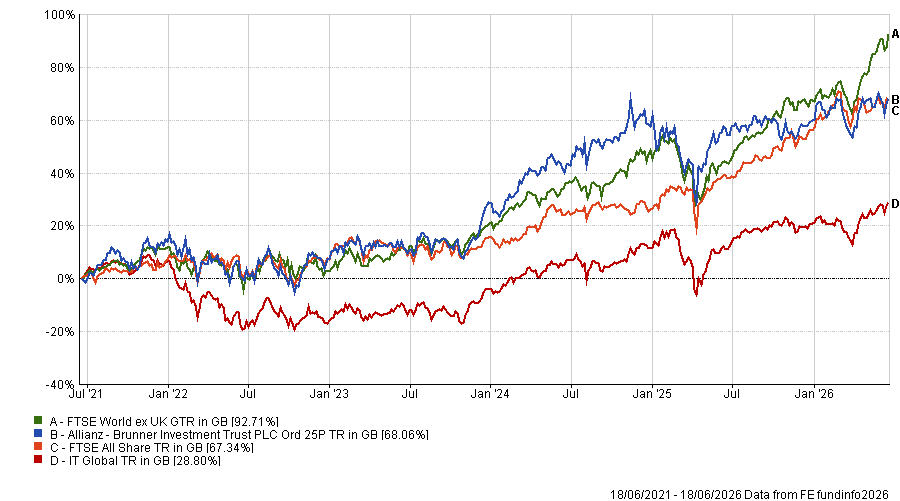
Source: FE Analytics
Please describe your philosophy and process.
We see each of our equity holdings as a cash flow stream and we want to get to a point where, when we forecast cash flow streams and model them, everything seems realistic and prudent. We are looking for names where if markets were to close tomorrow, we'd be happy just to own them and live off the cash flow stream.
We put a lot of emphasis on diversification – making sure that the cash flow streams we buy when we buy our equities are never too correlated. There's emphasis on downside protection and risk.
The benchmark is 70% global, 30% UK. Having a 30% weight in the UK, where you have more asset-heavy, cash-interested businesses, is a very sensible place to be at the moment, when the global market is so dominated by the United States and tech.
Why should investors pick Brunner over the competition?
We want to make money without taking stupid risks. Over the last five years we've delivered around 10% per annum in NAV growth. We have not entered the realm of ludicrously valued concept stocks and we have simultaneously not just gone for very defensive companies that have struggled to grow.
We're nowhere near as ideologically extreme as the likes of a Lindsell Train, which is all about consumer staples and asset-light businesses – a lot of which have really struggled because of fear of disruption by AI – or a Scottish Mortgage, that has SpaceX.
We have this all-weather framework: a wide range of uncorrelated equity investments that are as good quality as possible, grow as much as possible and are as good value as possible.
Where are you finding the most interesting opportunities right now?
A lot of what we're doing recently is turning up the value dial. In the US we're concerned about valuations and in the tech sector about speculation. The prudent thing is to go into slightly less glamorous businesses where there's more cash flow on offer.
As tech and semiconductors and AI have roared ahead, pretty much everything else has gone either sideways or down. That's particularly acute in asset-light businesses like software where there's widespread fear of disruption. We've been nibbling in those areas.
Do you have any examples?
Booking.com is one. It’s in a strong market position, good growth tailwinds and sold off hugely. Now you get a very good free cash flow yield. The company has negligible debt and can return all that cash via large buybacks.
Similarly, credit rating agency Equifax somehow got wrapped up in the AI sell-off. We don't think it's likely to be affected at all.
We also bought a little of RELX, having previously sold it at a very high multiple. We bought it back at literally half the price. And more recently, Progressive, a plain-vanilla US auto insurer. The PE [price-to-earnings ratio] is 11 or 12x, roughly half the overall US market. They're starting to get real scale benefits from the share they've won and we think they may be developing sustainable competitive advantages.
You still hold TSMC and ASML, which are among the market's most loved AI plays. Why haven't you sold if you’re so nervous?
In both cases, they're virtual monopolists with incredible barriers to entry. We've stuck with those. We're more reluctant to get involved in other areas of semiconductors where competitive advantages may prove to be very short-lived. There's such a scramble for all things semiconductors as the AI build-out takes place and super-normal profits being made. That strikes us as far more cyclical and unlikely to sustain.
But we are nervous. They've re-rated quite a lot and their earnings are high because these businesses are correlated with the AI capex cycle. The semiconductor market has always been prone to boom and bust.
What would prompt you to sell?
If there was mounting evidence that OpenAI and Anthropic were struggling to monetise or grow revenues at a rapid pace, that would be very worrying. If any of the big tech companies said they were going to cut AI capex, that would be a real red flag: at that point you'd see a big down cycle in semiconductors. We have already seen some signs of that. Oracle recently said they think capex is going to peak in 2028 and strongly implied it will come down after that.
If evidence mounts in this direction, we're kind of ready to sell. There are no sacred cows.
What were your best and worst calls over the past 12 months?
Google has been the biggest single contributor to performance over the past year (through the end of May), contributing around 3.7% to absolute performance. The trust began acquiring shares in May 2024.
TSMC, which we’ve held for more than 15 years, has also been terrific, contributing around 3.2% to absolute performance to the end of May.
A little more unusual is Kia, the South Korean car company. It’s a very deep value name – we paid a PE of around 2x cash for that. That's been really good for us, with a 1.1% contribution.
On the negative side, by and large it's been those perceived as AI losers. It's been a very binary market. The worst was Autotrader, the UK online used-car marketplace, which cost 1.2% of absolute performance.
The market has been going from one digital business to another, de-rating them on the basis that a change in technology will somehow weaken the barriers to entry that support their economics.
We decided to keep Autotrader, and it's been very dramatically de-rated. The shares went down 40%. No huge operational problems; profit forecasts came down slightly for unrelated reasons. It was really a sentiment issue.
What do you do outside of fund management?
I like opera, classical music and football.
Individual ESG investing is not a futile gesture but the first link in a compounding chain of behaviour, identity and demand that grows more powerful as more people join it.
Sustainable investing has genuine problems: the supply chains are murky, the data is inconsistent and some of the largest institutions have walked away from their commitments. And yes, over the past few years, ESG funds have underperformed their conventional peers in periods when defence and energy led the market.
But the conclusion some draw from this, as my colleague Matteo Anelli did last week – that individual investors might as well not bother – conflates the difficulty of doing something with the pointlessness of doing it.
Matteo's issues with ESG run roughly as follows. There's an intractable verification problem: exclude oil and gas and you find yourself holding solar panels with Xinjiang supply chains or wind turbines tied to contested cobalt networks. Returns have suffered: the average ethical fund returned 10.3% in 2025 against 12.2% for conventional peers and defence stocks, which ESG portfolios can't touch, were among the year's strongest performers. And if BlackRock, JPMorgan and others have retreated from their own ESG commitments, what hope does an individual investor's ISA have?
His conclusion is that single investors cannot act as the conscience of markets. While I agree with him about most of the problems facing sustainable investors, I come to a very different conclusion that rests on two concepts investors already understand: total return, which can mean more than most assume, and compounding, which applies here to decisions as much as to capital.
Of course, ESG funds underperform in some periods. They also outperform in others. This is true of every investment factor ever identified. Value investing underperforms for years at a stretch but nobody concludes from a bad year for value that analysing company valuations is a waste of time.
What's more, ESG is the only investment factor that also delivers something no other factor can: alignment between your capital and your values. Whether that alignment matters to you is a personal question but for investors to whom it does matter, it becomes part of their total return.
Consider how conventional finance already treats this. Investors routinely accept lower expected returns in exchange for lower volatility: that trade-off is not seen as irrational, it is the entire basis of portfolio construction. A risk-adjusted return is simply a return that accounts for something the investor cares about beyond the raw number.
Values-alignment works the same way. If holding a fund that reflects your principles reduces the psychological cost of staying invested through turbulent periods, it directly improves one of the most measurable drivers of long-run returns: the investor's own behaviour. People sell at the bottom less often when they believe in what they own.
But the case for individual ESG investing does not rest on returns alone. It is about what happens when a person takes one small, manageable step and then keeps taking it.
Behavioural research suggests small actions that are easy to repeat do get repeated. Over time, repeated behaviour becomes habit. Habit becomes identity. Once "I invest with my values in mind" is part of how a person thinks about themselves, the cognitive effort involved falls sharply. Decisions that once required research and deliberation start to feel obvious.
The reverse is equally real. Once ethical behaviour is embedded in someone's identity, actions that contradict it create discomfort, so avoiding funds with problematic holdings or poor governance stops being a chore and becomes a reflex. The compounding is psychological as much as financial.
Think also about the compounding effect when enough people make the same imperfect choice.
Companies produce the goods and services that consumers demand. When enough consumers shift away from a product, demand falls. Companies respond to this falling demand: they make less of what is not selling, or they improve what they make to win customers back.
I agree that regulation will drive the largest structural changes and technology will enable them, having far more impact than any one individual investor. But individual action and systemic change reinforce each other. Consumer behaviour shifts make regulation politically viable and create the commercial pressure that accelerates it. Technology scales what consumers have already demonstrated they want.
The individual is not powerless: the aggregation of imperfect individual choices is how consumer markets have always shifted, from lead in petrol to plastic straws to the mainstreaming of electric vehicles.
No single vote decides an election. No single consumer drove the shift away from single-use plastic. Change at scale is always the aggregate of actions that looked individually insufficient. The assumption that unless you can act perfectly and at civilisation-defining scale it is not worth acting at all would, applied consistently, bring all human agency to a halt.
So the question is not whether your ISA will resolve the climate crisis. It will not. The question is whether a world in which millions of investors make slightly more thoughtful decisions with their capital is better than one in which they do not.
I think it is.
Gary Jackson is head of editorial at FE fundinfo. The views expressed above should not be taken as investment advice.
Big tech’s AI capex boom is ‘gargantuan’, according to BNY fixed income manager.
The rapid expansion of AI has largely been an equity story, but the biggest, cash-hungry players are increasingly turning to bond markets to fund themselves, which will have implications for investors.
Damien Hill, co-manager of BNY Strategic Bond, said: “The AI hyperscalers have been borrowing probably 15-20% of all US investment-grade issuance over the year to date, which is gargantuan.”
Issuance is accelerating alongside the race to build-out data centre capacity and while it is “nowhere near the concentrations that are already there in the equity market”, Hill warned that, if hyperscalers continue at this run rate, bond markets may well reach the same levels.
“At which point, you will have a lot of investors wanting more diversified portfolios and not liking that degree of concentration,” he said.
Recent activity illustrates how quickly bond markets are changing.
In 2025, the largest hyperscalers – including Amazon, Alphabet, Meta and Oracle – issued around $120bn in US corporate bonds versus an average of $28bn per year between 2020 and 2024.
2025 US tech stock AI bond issuance (in USD)
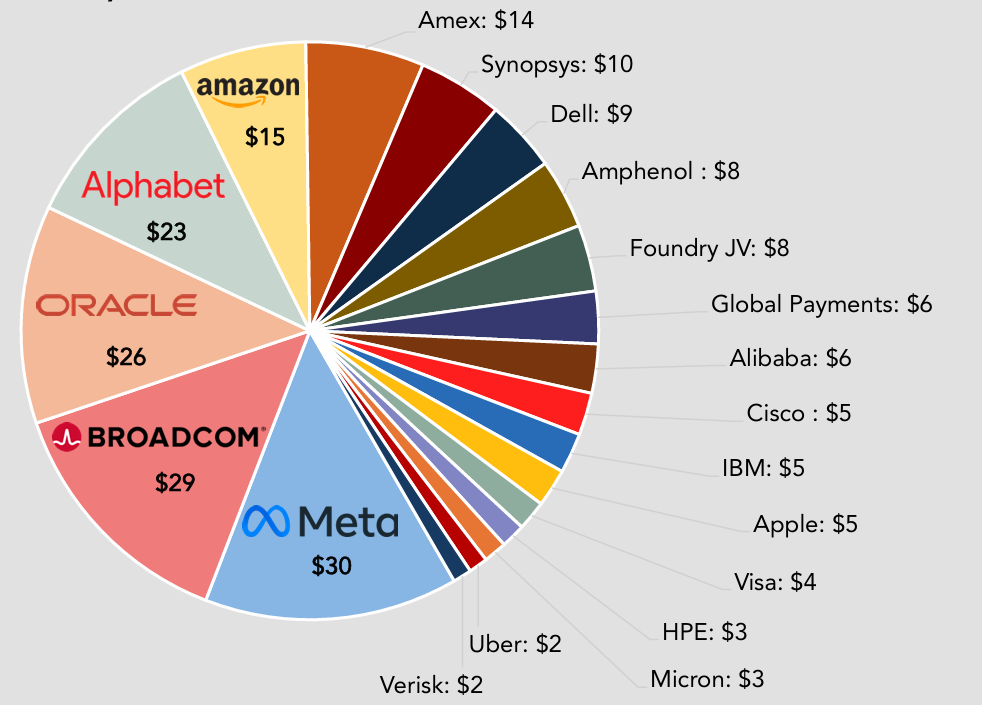
Source: MUFG Bank
Morgan Stanley forecast that AI-related global debt issuance will more than double in 2026 to reach $570bn, driven by sizeable increases in hyperscalers’ capital expenditure plans. As of 31 May 2026, global debt issuance linked to AI was already estimated at $236bn.
Japan’s MUFG Bank has predicted the hyperscalers will spend $1.4trn between 2025 and 2028 on global data centres, with an additional $1.5trn coming from private credit, corporate debt, securitised credit and other capital.
Data centre spend, 2025-2028
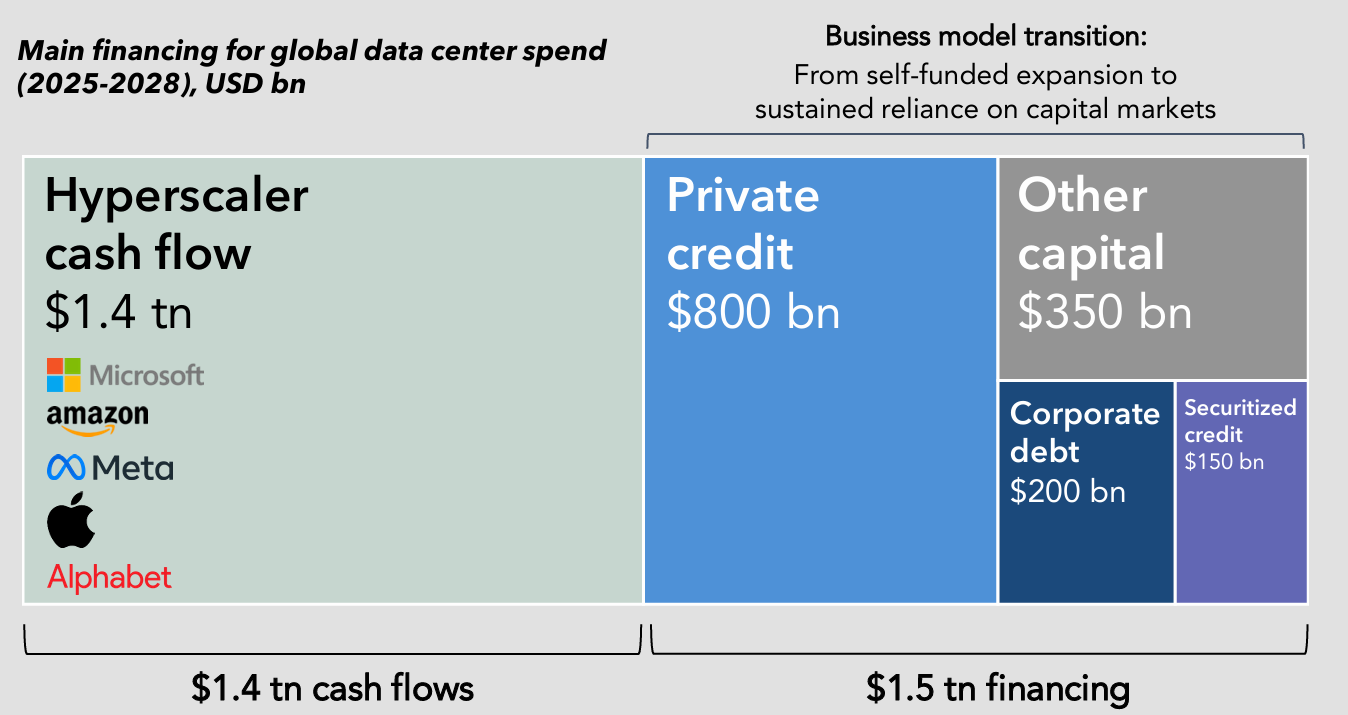
Source: MUFG Bank
This scale of debt is not only being raised in the US, with hyperscalers turning to foreign currencies too.
Amazon sold $14bn of Canadian dollar high-grade bonds and €14.5bn in euro-denominated bonds, while Alphabet sold ¥576.5bn in yen-denominated bonds and launched a 100-year bond in sterling markets. The last tech company to issue a ‘century bond’ was Motorola in 1997.
“They are borrowing at levels that are making other borrowers with similar credit ratings look expensive – because the hyperscalers are all rated ‘AA’ or ‘AA+’, which is comparable to US treasuries or the UK government – and they are coming at quite cheap levels already,” Hill said.
“There is a scenario where they could crowd out other parts of the market and create some indigestion.”
But not all AI issuers carry the same level of risk, which means closer scrutiny is essential.
Richard Jones, portfolio specialist at Insight Investment, said: “Bottom-up credit analysis is needed – investors have to be confident in their fundamentals, their management team and their business model,” he said.
“If you look closer at the hyperscalers, some of them don’t have the same fundamental strength as others. It’s not a completely even market out there.”
One big AI player that has drawn some concern is Oracle. Last September, it tapped the bond market for around $18bn to fund its planned AI-related spend and its debt-to-equity ratio surged to 500%.
“Some of these companies are flying a lot closer to the sun, given the amount of cashflow they currently generate and how much they are betting on AI,” Hill acknowledged.
“Our analysts do the stress testing to assess how narrow a path a company is having to walk to make their investment in AI work – that AI bet will clearly have to be heavily priced into their bonds, otherwise we won’t look at it.”
Hill said that Oracle’s bonds are “considerably wider” – more yield, more extra spread – than higher quality names.
“We are talking multiple notches different, and then the cashflow generation is minimal relatively, given the amount of debt they have already strapped on.”
Earlier this month, Oracle’s stock dropped by as much as 10% after the cloud giant’s higher-than-expected capex plans fuelled concerns over its already high AI-related costs.
Stock price performance over 1yr
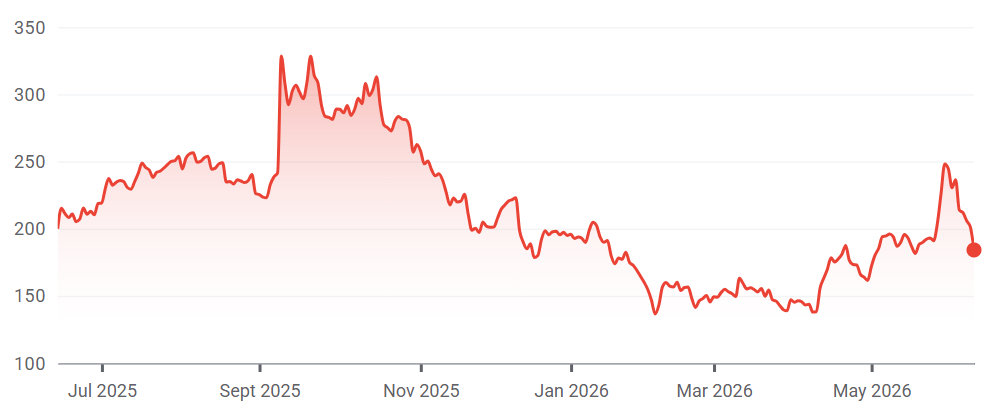
Source: Google Finance
For diversified fixed-income investors, the question is how to position around this wave of issuance.
Jones said the answer lies in using the full breadth of the bond universe.
“Within fixed income, you have tech sectors that are incredibly exposed to this theme of AI capex issuance but on the other side you have old economy utility sectors, which are quite insulated from that and can act as a natural hedge if there is any weakness within the tech sector,” he said.
Hill agreed, noting that utilities and telecommunication companies typically lend themselves much more to a consistent cashflow to pay debt back.
He added that there are other avenues to access the AI trade. “There are more asset-backed security-style structures backing data centres, for example,” he said, though emphasised that these also require rigorous bottom-up analysis.
Hill said they are keeping their approach “tactical” rather than allocating wholesale.
“We are not saying this is a massive buy across the board because there is so much more potentially to come,” he said.
The public listing has confirmed SpaceX’s dominance, but its valuation demands flawless execution.
SpaceX’s long-awaited initial public offering (IPO) arrived with numbers that immediately reshaped the upper end of the US equity market.
The company raised $75bn ahead of its record-breaking $1.8trn debut, pricing shares at $135, before opening on the Nasdaq at $150 – an 11% premium from the very start. The stock then surged as high as $176 intraday, with SpaceX closing its first day in public markets with a valuation above $2trn, making founder Elon Musk the world’s first trillionaire.
In the days following, momentum has continued as SpaceX stock climbed above $200, representing a nearly 60% growth from its IPO price and pushing its market capitalisation even higher – beyond $2.5trn.
Stock price performance in the days following IPO
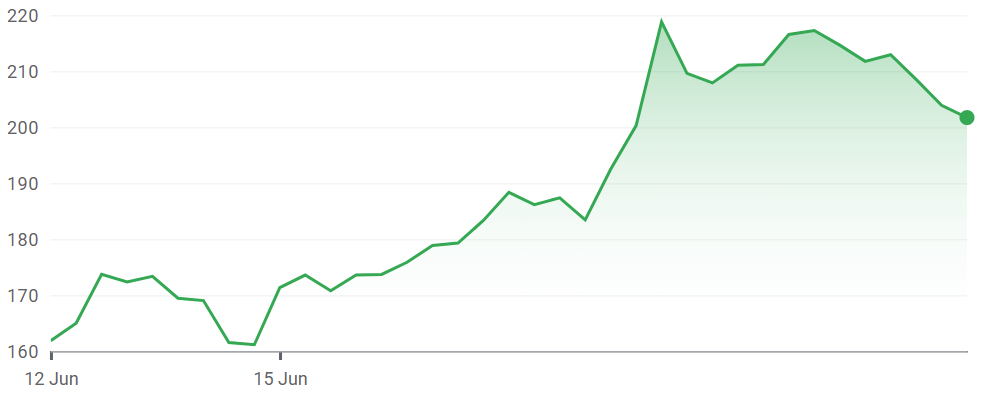
Source: Google Finance
However, managers across the market have flagged their concerns around SpaceX’s valuation, highlighting the gap between the company’s current financials and the price.
SpaceX generated $18.7bn of revenue in 2025 and posted a net loss of $4.9bn, meaning investors bought in at roughly 100x sales on IPO day.
David Coombs, multi-asset fund manager at Rathbones, said the figures attached to the listing were “eye-watering” – particularly when compared to other large and popular companies.
“For context, Tesla trades at about 16x last year’s sales,” he said. “Even Nvidia, the poster child of the AI boom, sits at 25-30x.”
Joakim Agerback, lead manager of the Finserve Global Security fund, added that the valuation “leaves little room for anything short of exceptional execution and total dominance in the sector for a long period of time”.
For some managers, that gap presents a real risk to portfolios. Sean Peche, manager of Ranmore Global Equity, drew a direct parallel with pharmaceutical giant Pfizer.
"If you bought shares in Pfizer in April 1998, before Lipitor generated more than $130bn of sales and before its Covid-19 drug Cominarty generated a further $95bn, you would be pretty upset,” he said.
“Bloomberg tells me your total return would be -26% over 28 years, [and] had you bought in June 2000 after the excitement of the additional revenue and pipeline acquired from the Warner Lambert acquisition, you would be down 44%.”
Stock price performance since 1990
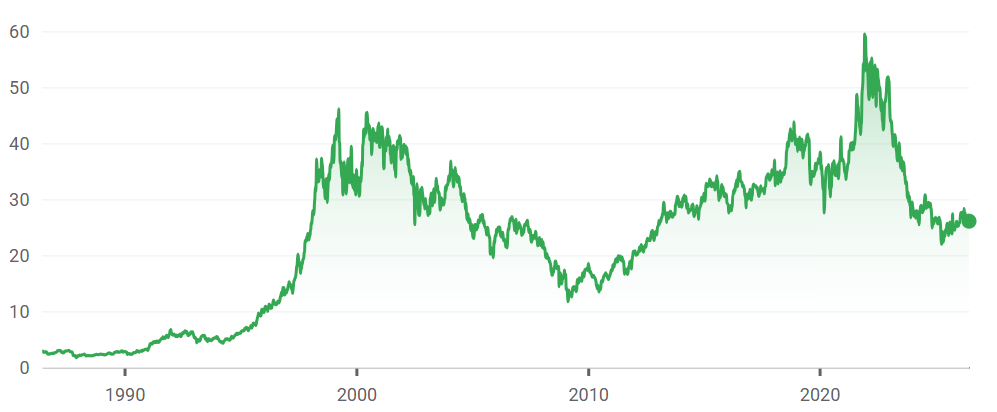
Source: Google Finance
The problem, Peche argued, was not the business itself but the price investors were willing to pay for the story.
“Stories are about the past but it is the future that kills you,” he noted. “Forecasting growth over five years is an impossible task and the growth rate usually falters for some unexpected reason at some point. When it does, the de-rating can often be worse than feared.”
The volatility of such a high valuation has already shown itself within the first week of public trading, as SpaceX shares fell 5% on Wednesday 17 June, trimming its debut rally.
Yet for long-term growth investors, the bull case for SpaceX remains compelling.
Tom Slater, manager of Scottish Mortgage Investment Trust – which has high exposure to SpaceX – said the company is not just a rocket company but “is becoming infrastructure for the global economy”.
“Starlink already serves over 10 million subscribers across more than 160 countries and we think that business is still in its infancy,” he said, adding that the opportunity broadens materially when considering mobile connectivity, defence, aviation and maritime.
“We have followed this company closely for many years and our conviction in its long-term potential has only grown,” Slater said.
Mark Boggett, chief executive officer of Seraphim Space Investment Trust, took a similarly expansive view, noting that SpaceX has fundamentally changed the economics of access to space, with “its scale, execution and vertical integration making it one of the most important companies in the sector, which is why the IPO attracted such significant attention”.
Boggett added that SpaceX going public helps to reinforce space as a mature and investable commercial market rather than a niche technology theme.
Alongside the long-term optimism, however, managers also point to a separate set of considerations that have little to do with technology or market opportunity and more to do with SpaceX’s governance structure and the degree of control held by its founder.
SpaceX has listed with a dual-class share structure that gives Musk around 82% of voting rights through Class B shares, while public investors hold one-vote-per-share Class A shares. For some managers, this concentration of power is a material consideration.
While not all of Musk’s companies have a dual-class share structure – for example, Tesla does not – managers argue that his dominant ownership and influence across his businesses raises governance concerns.
Henry Birt, senior research analyst at JM Finn, said: “Whilst arguably exposure to Musk’s entrepreneurship is positive, he has a history of erratic decision-making and without the proper checks and balances on this power, it is hard to guarantee these decisions will be made in the best interests of shareholders.”
For investors trying to navigate that risk, the comparison between Musk’s two listed companies – Tesla and SpaceX – may be unavoidable.
Julian Wheeler, partner at Shard Capital, acknowledged that Tesla remains something of an “Elon-cult-stock” in that it is highly polarising, with a valuation that still reflects considerable optimism beyond its core electric vehicle business. But relative to SpaceX, he argued, that premium looks modest.
“SpaceX has genuine strategic scarcity value – but not at any price,” he said, noting that the entry point carries real risk.
“An exceptional company can still be a poor investment if the starting price is too high.”
By contrast, Tesla’s bear case is “arguably weaker than it was”, according to Wheeler, as the stock has underperformed other high-multiple growth companies and its valuation is less stretched relative to peers.
Of the two, Wheeler said he would currently prefer to own Tesla – with electric vehicle (EV) adoption in the US expected to accelerate as price points improve and charging infrastructure matures.
“Elon Musk is such a bifurcating figure – the reality is investors are likely to own both or neither,” Wheeler said.
“From our perspective, each company should be analysed individually. If both are priced attractively relative to its value, then governance and ownership risk mean both should be owned at a reduced level.”
To own SpaceX, Wheeler said he would need to see Starlink demonstrate stronger annual recurring revenue (ARR) growth and the non-Starlink business move from R&D into operational execution. For Tesla, the threshold is lower – a refreshed product line and stronger evidence of demand recovery.
There is a longer-term strategic dimension worth watching, however. Wheeler suggested that Musk may seek to bring Tesla and SpaceX closer together over time, potentially using highly valued SpaceX equity as part of a broader transaction – a move that could reshape the investment case for both companies simultaneously.
There is now a structural undervaluation of UK plc by public market investors of all stripes
UK stocks are getting picked off consistently by both overseas and domestic corporations, or private equity firms. The numbers show a remarkable story: we're not even halfway through the year and the total value of UK takeovers for 2026, should they all complete as planned, is £39.3bn – 33% more than the £29bn value of deals in the whole of 2025 and, at 28 deals so far, they're coming at a rate of more than one per week, according to analysis from the investment platform AJ Bell.
The companies at the centre of this bidding frenzy come from all walks of life, from Nuveen's £10bn takeover of Schroders and Zurich's £8bn offer for Beazley, all the way down the market-cap spectrum, through Ingredion's £2.5bn approach for Tate & Lyle to Animalcare's take-private by Charterhouse Capital Partners for £235m.
Many have sounded the alarm at the shrinking of UK public markets, with performance suggesting a dearth of good companies in which to invest. One could certainly read the data that way; why else would UK investors, according to the Investment Association, have pulled a net £74bn out of UK equity funds since the start of 2016?
All of the above goes to show that there is now a structural undervaluation of UK plc by public market investors of all stripes. But who exactly is this benefiting? It's benefiting those private equity funds and trade buyers that are picking UK businesses off at alarmingly cheap valuations.
Indeed, of the 22 deals agreed so far this year where the terms have been made public, the average premium offered relative to the undisturbed share price was 45%.
This is a theme we've seen for a few years now. Broadening the data out to all UK companies, the number of inward acquisitions (that is, foreign companies acquiring UK companies), you see a real step-change.
Between 1986 and 2017, the average number of inward acquisitions was 180 per year; since 2018, that number has risen to 693, according to the Office for National Statistics (ONS).
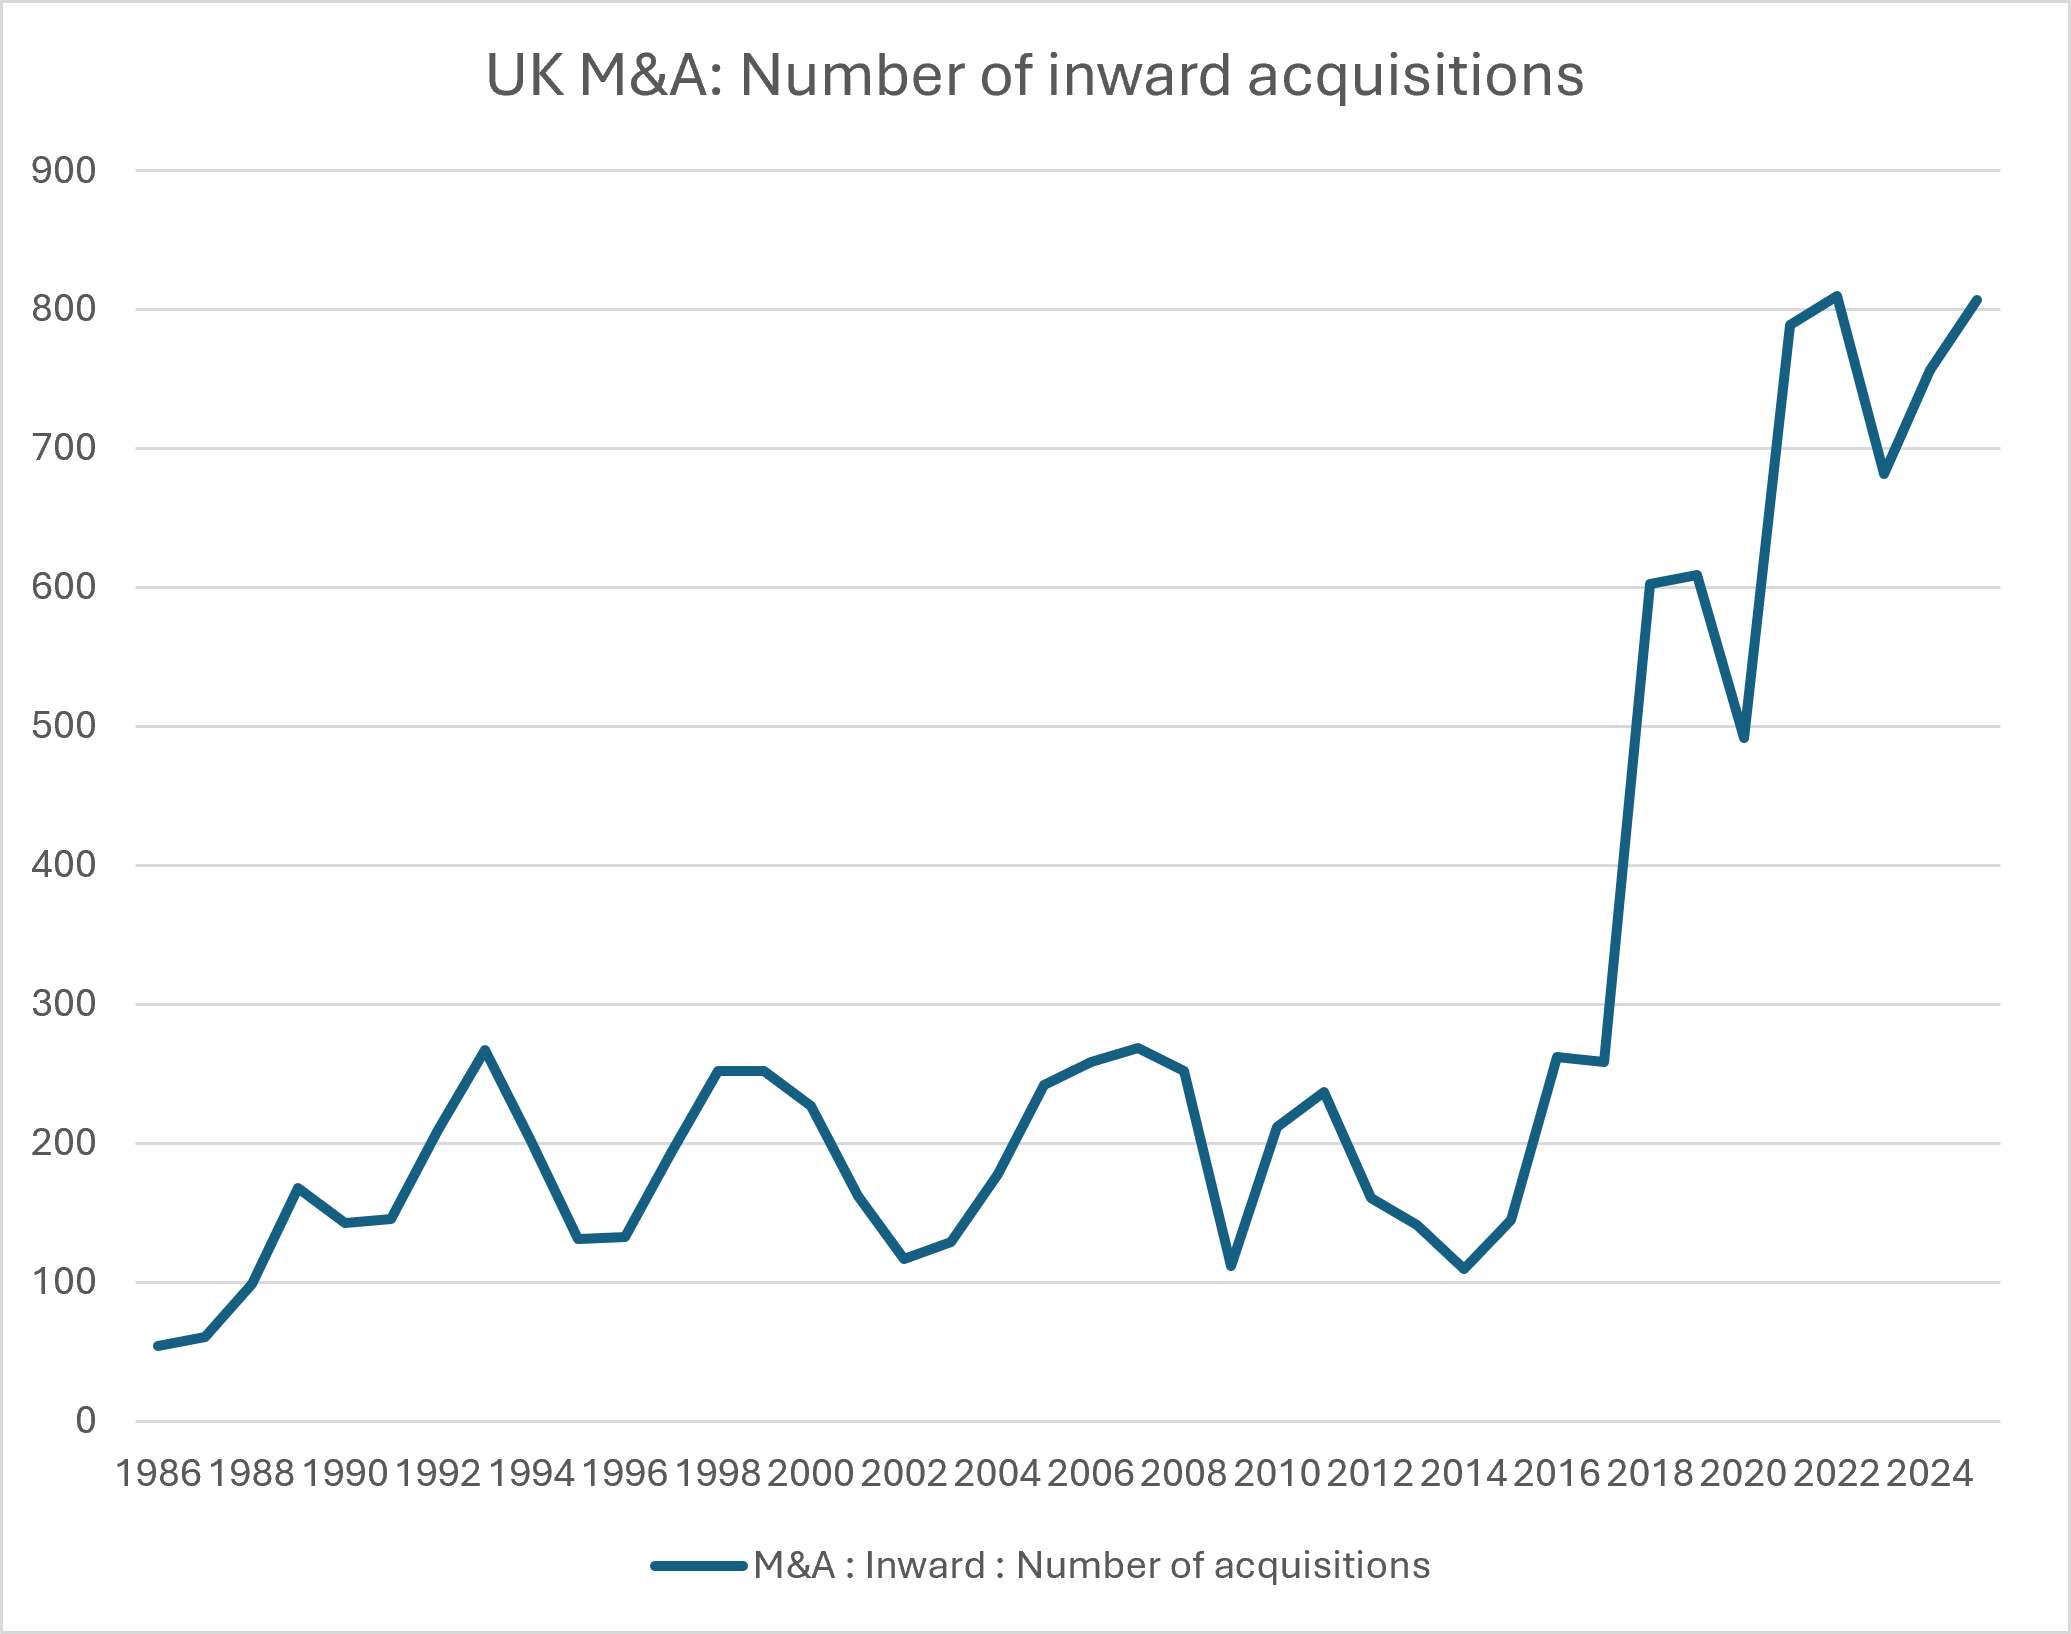
Source: ONS
So, where does this all leave us? We suspect the constant selling of UK plc by retail investors is so they can stock up on the winners of the past (i.e. US big tech, through passive, index-tracking funds). In our view, investors should be looking ahead, not to what has already happened.
Valuation and concentration risk in broad global markets is high, but this doesn't mean investors need to dial down equity exposure. Rotating into cheaper markets should improve diversification and, hence, potential future returns.
It's very possible that we're seeing a potentially generational investment opportunity within UK SMID caps. To us, the sheer number of UK companies being taken out just shows that the UK market is packed with excellent businesses that are attracting suitors from around the world.
Of course, it's impossible to tell exactly what and when the catalyst will be to bring public market investors back to UK SMIDs, but, after more than a decade of consistent outflows, we are surely closer to the end of this trend than the start. We certainly don't think that one should be jumping off the train at this point in time.
Schroder UK Mid Cap recently agreed to propose a tender offer to try to draw a line under a campaign by Saba Capital, which has a 19.5% stake, against the trust.
Saba has said that it will support the proposal and tender its shares, which makes sense for the activist hedge fund, but for ordinary investors tempted to participate, it would be akin to throwing the baby out with the bathwater, in our view.
In fact, SCP is one of the best-placed trusts around to capture any re-rating of UK mid-caps (as the trust's name suggests). Managers Jean Roche and Andy Brough have constructed a portfolio of 50 names focused purely on the FTSE 250, which they believe offers a mixture of leaders from niche or growing industries.
Jean and Andy also like the FTSE 250 as it is regularly refreshed thanks to promotions and demotions from other parts of the market as well as IPOs, providing a steady stream of world-class opportunities.
Another mid-cap focused trust where the rating may not reflect the potential is Mercantile, where managers Guy Anderson and Anthony Lynch invest predominantly in mid-caps, with historically around three quarters of the portfolio in FTSE 250 companies.
Guy and Anthony's bottom-up process focuses on company fundamentals to identify high-quality businesses that are generating positive momentum and are available at attractive valuations.
One option that scours the whole of the market is Fidelity Special Values. Managers Alex Wright and Jonathan Winton take an unashamedly contrarian and value-focused approach, with performance driven by bottom-up selection.
We think that this provides resilience when positive developments are being overlooked (such as now) and enables FSV to outperform across different market cycles and environments.
Moving down the market-cap scale, Rockwood Strategic is a highly differentiated trust that has outperformed even its lofty 15% annualised goal over the long term thanks to manager Richard Staveley's bottom-up process, which has led to a highly concentrated portfolio of between 20 and 25 undervalued, micro-cap companies.
This concentration enables Richard to take sizeable stakes in his holdings, supporting his approach of collaborating with management teams to help instigate a turnaround.
The fund has already this year benefited from two takeover bids at Treatt Plc and Van Elle Plc, both at significant premiums.
We see plenty of reasons why public market investors might return to reassess the attractions and cheapness of UK stocks, hence putting a stop to the picking off of UK plc by acquirers and hopefully breathing life back into an important part of the economic ecosystem.
David Brenchley is an investment specialist at Kepler Trust Intelligence. The views expressed above should not be taken as investment advice.
Kevin Warsh's first FOMC meeting kept rates on hold but produced a hawkish dot plot that surprised markets.
The Federal Reserve kept its benchmark interest rate unchanged at Kevin Warsh's first meeting as chair on 17 June but projections from committee members pointed to possible rate rises before year-end, catching most analysts off guard.
The rate-setting federal open market committee (FOMC) voted 12-0 to hold the federal funds rate at 3.5% to 3.75%. The accompanying statement was brief, containing no forward guidance, removing a hint it was leaning towards lower future interest rates and concluding: "The Committee will deliver price stability."
The summary of economic projections showed nine of 18 FOMC participants expect policy tightening before year-end. There should have been 19 but Warsh did not submit his own projections.
Three favour increases of 25 basis points, five favour 50 basis points and one favours 75 basis points. The median projection for the federal funds rate at end-2026 moved to 3.8% from 3.4% in March.
FOMC dot plot
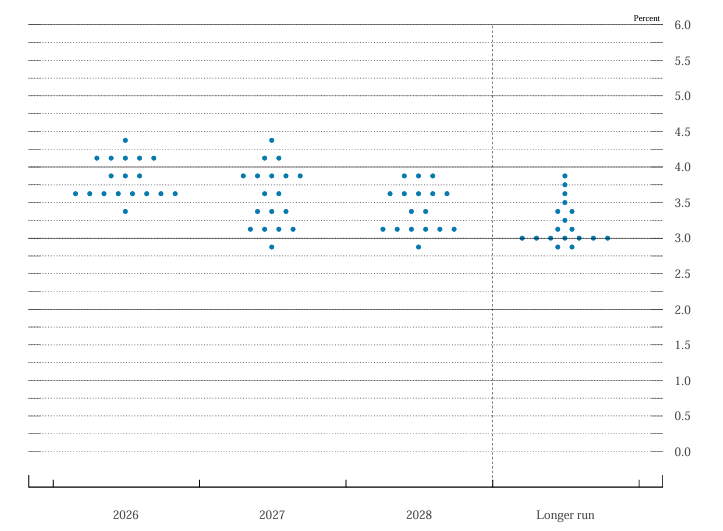
Source: Federal Reserve
Neil Wilson, investor strategist at Saxo UK, said the statement's brevity and its omission of the Fed's employment mandate were significant.
"An incredibly short statement – the headline for me was that the Fed 'will deliver price stability'. No fluff. And no reference there to the labour market side of the dual mandate, which tells us a lot about where the Fed is right now. As stated today, the Fed is short one side of the dual mandate and it's not employment. That statement shows it's minded to hike. How does Trump take this?"
Wilson also pointed to the fact that Warsh had not submitted his own projections: "A missing dot on the plot... Warsh stuck to his guns and refrained from publishing his views. Otherwise the dots were hawkish, which says a lot."
The dot plot was more hawkish than Pantheon Macroeconomics had expected.
Economists Samuel Tombs and Oliver Allen had forecast only three participants would signal hiking before year-end. They said last week's inflation data was likely a factor in the shift: May's CPI and PPI figures collectively imply core PCE inflation rose 0.4% in the month.
Two-year treasury yields rose by approximately 10 basis points after the decision. Wilson said front-end rates moved higher on expectations of a tighter Fed while longer-dated yields fell, suggesting markets may already view the new regime as more credible on inflation.
"Warsh is not giving the market a heck of a lot of rope with which to hang him, which has to be a good thing," Wilson said.
Warsh did not disclose his own policy views during the press conference. He announced five new taskforces that will examine the Fed’s communications, the balance sheet, data sources, AI's impact on productivity and jobs, and the drivers of inflation.
Tombs and Allen said the decision not to submit projections made political sense. A rate cut forecast would have drawn accusations that Warsh was acting on behalf of the White House but a no-change forecast risked antagonising the administration.
Stuart Clark, portfolio manager at Quilter, said the hold was the only realistic option: "Kevin Warsh has kicked off his chairmanship of the Federal Reserve with a hold in interest rates, signalling the regime change that many expected may have to wait.
"Ultimately, Warsh and the Fed board had little choice but to keep rates where they are."
Clark noted that energy prices had not returned to pre-conflict levels following the US-Iran memorandum of understanding and were unlikely to do so.
"This situation is entirely of the US' own making and with energy prices likely to remain elevated relative to the start of the year, inflation isn't going to suddenly begin to fall," he said.
President Trump, Clark added, "will likely remain as frustrated with the new leadership as he was with the old one".
Pantheon Macroeconomics' Tombs and Allen said the hawkish projections should be read as a communications strategy rather than a commitment to act.
"Yesterday's communications are best viewed as an attempt by the FOMC to anchor inflation expectations and therefore reduce the likelihood that interest rates actually will need to be hiked," they said.
Warsh's own comments supported this view, telling reporters that FOMC participants "didn't feel bound by them six weeks from now or six days from now, in the event that their circumstances change" by their projections and that he "didn't hear tons of conviction".
Tombs and Allen also noted that the Fed's legal mandate had not changed. Section 2A of the Federal Reserve Act requires the FOMC to pursue maximum employment alongside price stability. They said most voting members would be unlikely to support rate rises if unemployment drifts above the FOMC's own median projection of 4.3% later in the year, as Pantheon expects.
But the analysts reached different conclusions on what the Fed will do next.
Wilson said a rate rise next month was possible. He noted that the new communications approach means markets will not receive advance warning of decisions: "I think it could happen as early as July and the good thing about this new-look Fed is that we won't get to know until the meeting!"
Quilter's Clark said a rate rise before year-end was a possibility. He cited inflation at a three-year high of 3.8%, alongside better-than-expected employment data and consumer spending figures released on the day of the meeting. It was, he said, "not out of the realms of possibility that the Fed will have raised rates by the end of this year, instead of cutting them as was expected at the start of 2026".
Tombs and Allen maintained their view that rates would remain on hold in 2026: "We still think, however, that the committee likely will keep rates on hold this year". They said energy prices were squeezing household incomes without driving wage growth or broader price increases. High borrowing costs and the effect of AI on hiring were also weighing on employment. Their forecast is that the Fed cuts rates by approximately 75 basis points in spring 2027 to address rising unemployment.
Clark argued that Warsh's position on artificial intelligence could shape the rate path.
"Warsh is of the opinion that artificial intelligence will usher in a disinflationary period as productivity increases and the cost of doing things falls. This is a punchy prediction and could easily end up proving wrong given the current debates around return on investment from AI, but it may just be the cover he needs to begin the move to bring interest rates down and appease the president," he explained.
Managers cite decade-low valuations, a rare FTSE 250 yield inversion and rising takeover premia as reasons to build exposure.
Investment trust managers are beginning to rebuild exposure to UK mid-caps, arguing that the FTSE 250 now offers some of the most compelling valuations in global equities.
Over the past few years, the index’s more domestically tilted profile was damaged by post-Brexit sterling weakness and the persistent outflows from UK equity funds. Poor sentiment has subsequently weakened valuations across the board among UK mid-sized companies.
That backdrop has created what some managers describe as a rare opportunity.
Simon Gergel, lead manager of Merchants Trust, said valuations have moved to levels that are difficult to reconcile with fundamentals.
“Companies in the FTSE 250 are trading well below its last 10-year average rating – and miles below the rest of the UK and international markets. That is highly unusual,” he said.
“Yet mid-cap companies in the UK are expected to trade at a premium to larger companies because they have historically delivered better growth. At the moment, they are at big discounts due to poor sentiment.”
Jean Roche, manager of Schroder UK Mid Cap Investment Trust, pointed out that many UK mid-caps are still delivering strong earnings growth despite being priced cheaply at an average of 12x earnings.
“A mid-cap company may be growing its top line by 5% and the bottom line by 10% but be trading on 10x earnings – it just doesn’t make sense,” she said, noting that Schroder UK Mid Cap portfolio holdings have an average earnings growth of 13%.
Another clear signal is that the FTSE 250 is yielding more than the FTSE 100. According to FTSE Russell data, the FTSE 250 yields 3.53% and the FTSE 100 yields 3.06%, as of 29 May 2026.
Gergel said: “It is very unusual for the FTSE 250 companies to be on a higher yield – and that is where we are going to be focusing our buying in that area as we reduce the FTSE 100 exposure over the coming period.”
He noted that Merchants Trust has around half of its portfolio in FTSE 250 stocks, particularly among the most domestic names in real estate, retail and construction.
James Henderson, manager of Lowland Investment Company, made the same point, also noting he plans to focus on buying in the mid-sized market as he reduces the trust’s FTSE 100 exposure.
Henderson said the yield anomaly reflects years of underperformance among domestic earners.
“UK medium and smaller companies have been underperforming the large, and that's because UK medium and smaller have much more exposure to the UK domestic economy,” he said, putting this down in large part to the ramifications of Brexit.
Performance of FTSE 250 vs FTSE 100 since Brexit
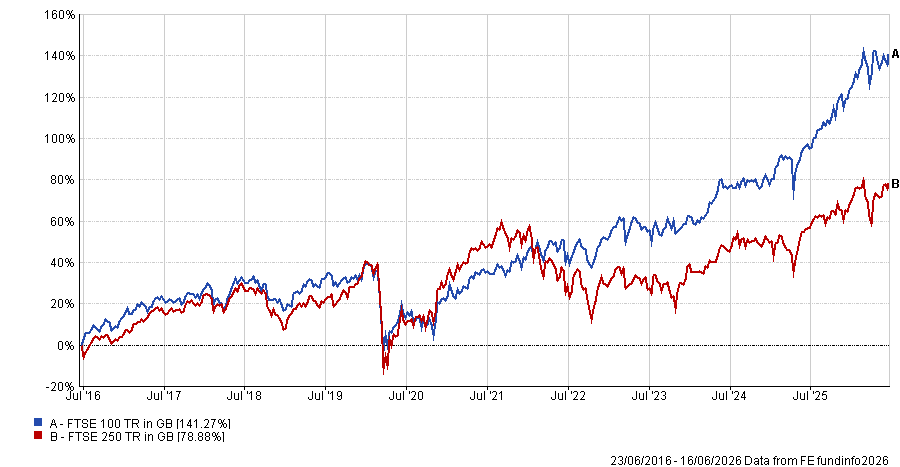
Source: FE Analytics
“Hopefully, it has now played itself out, leaving these companies looking cheap,” Henderson said.
But zoom out to before Brexit and the picture changes. Roche pointed out that the longer-term performance of UK mid-sized companies tells a much more positive story, as the FTSE 250 excluding Investment Trusts has outperformed most developed market indices and kept pace with the S&P 500.
FTSE 250 ex Investment Trusts vs large developed markets (total return %)
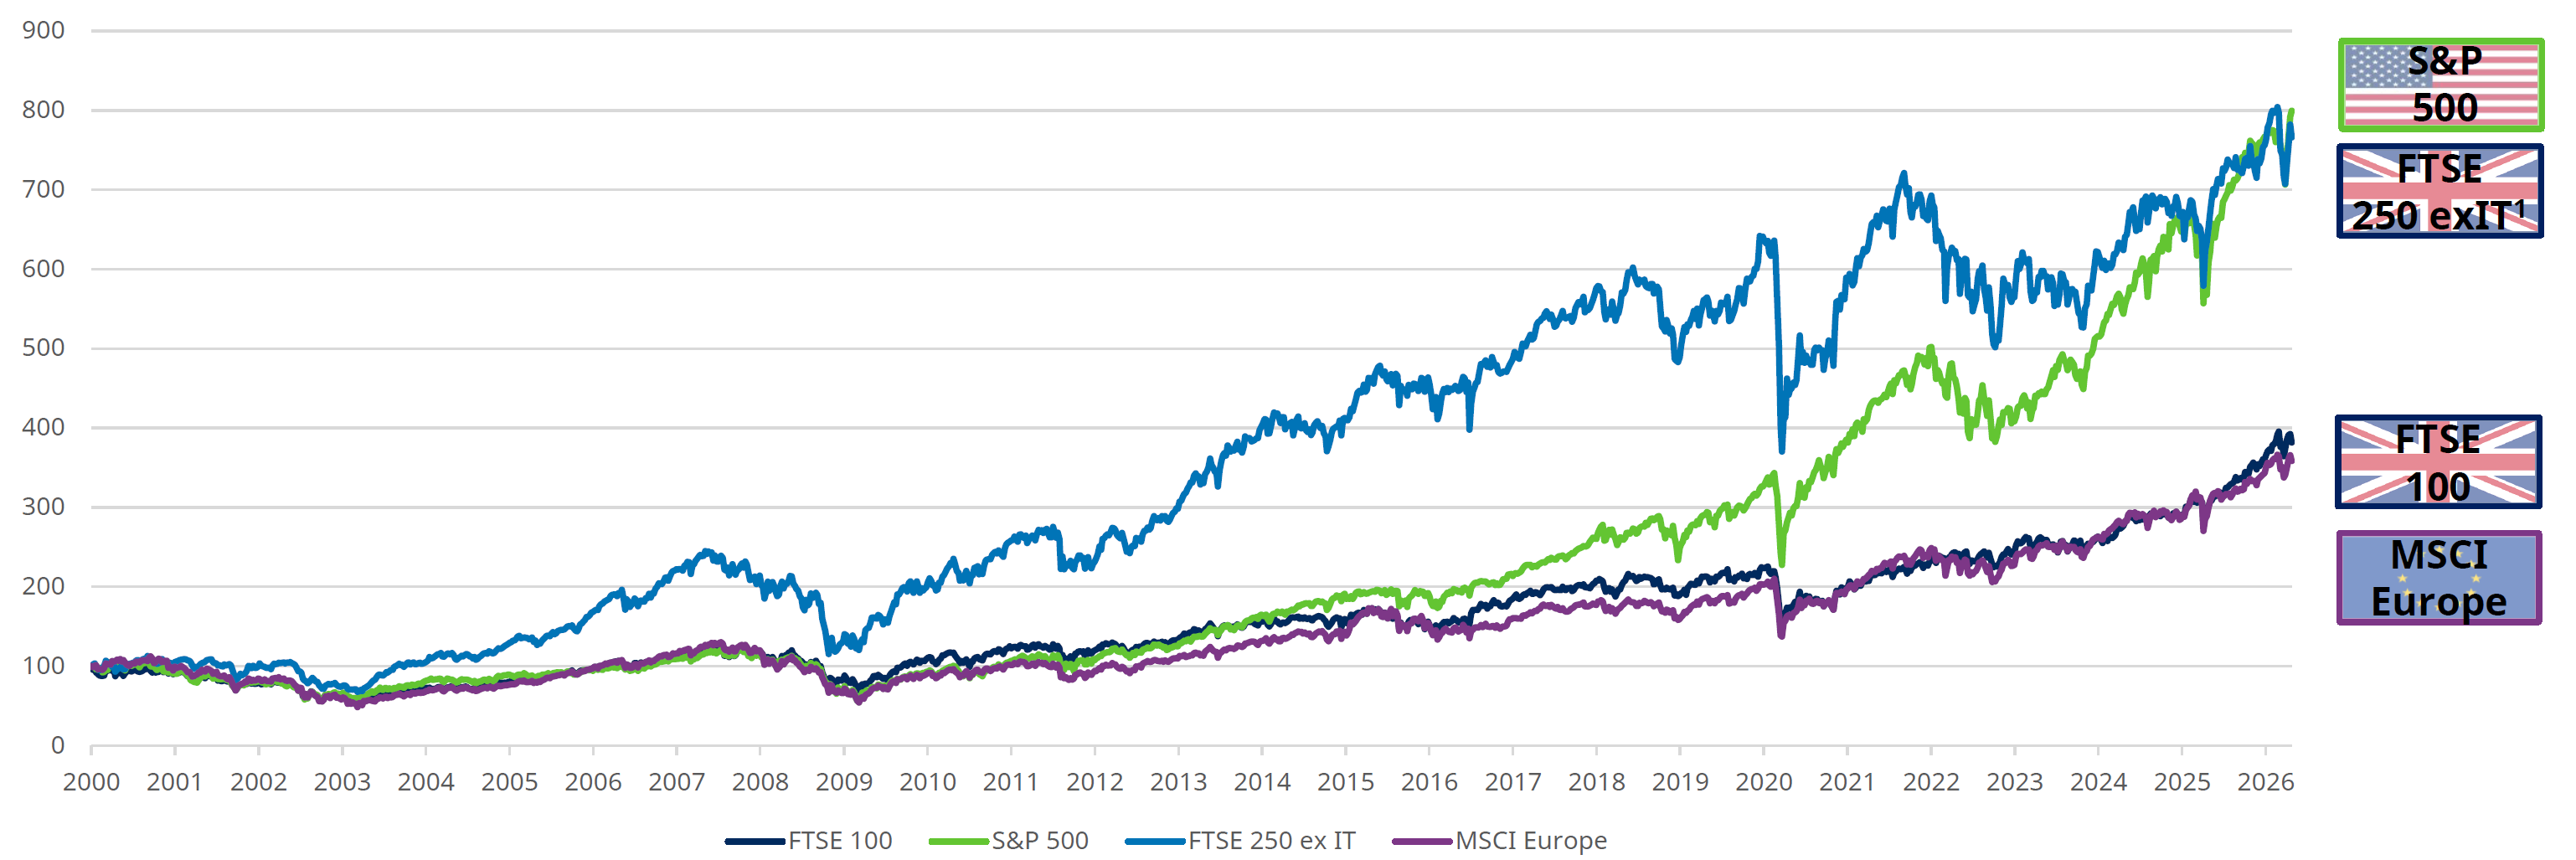
Source: Schroders, Refinitiv Datastream. Rebased to 100 at 1 January 2000, data to 1 May 2026. Currencies are base currencies for individual indices.
Roche said this is because mid-caps sit in a sweet spot between small-cap alpha potential and large-cap stability.
“These are mature, cash-generative companies that are still small enough to be acquired,” she noted.
“Within Schroder UK Mid Cap, we had two companies – Just Group and Spectris – taken out last year at 75% and 100% premia and they represented 8% of the trust. The more typical premium in the UK market is 30-35% but in mid-cap land we have been seeing premia of closer to 50% for two years running.”
Value of completed acquisitions as % of index starting market cap
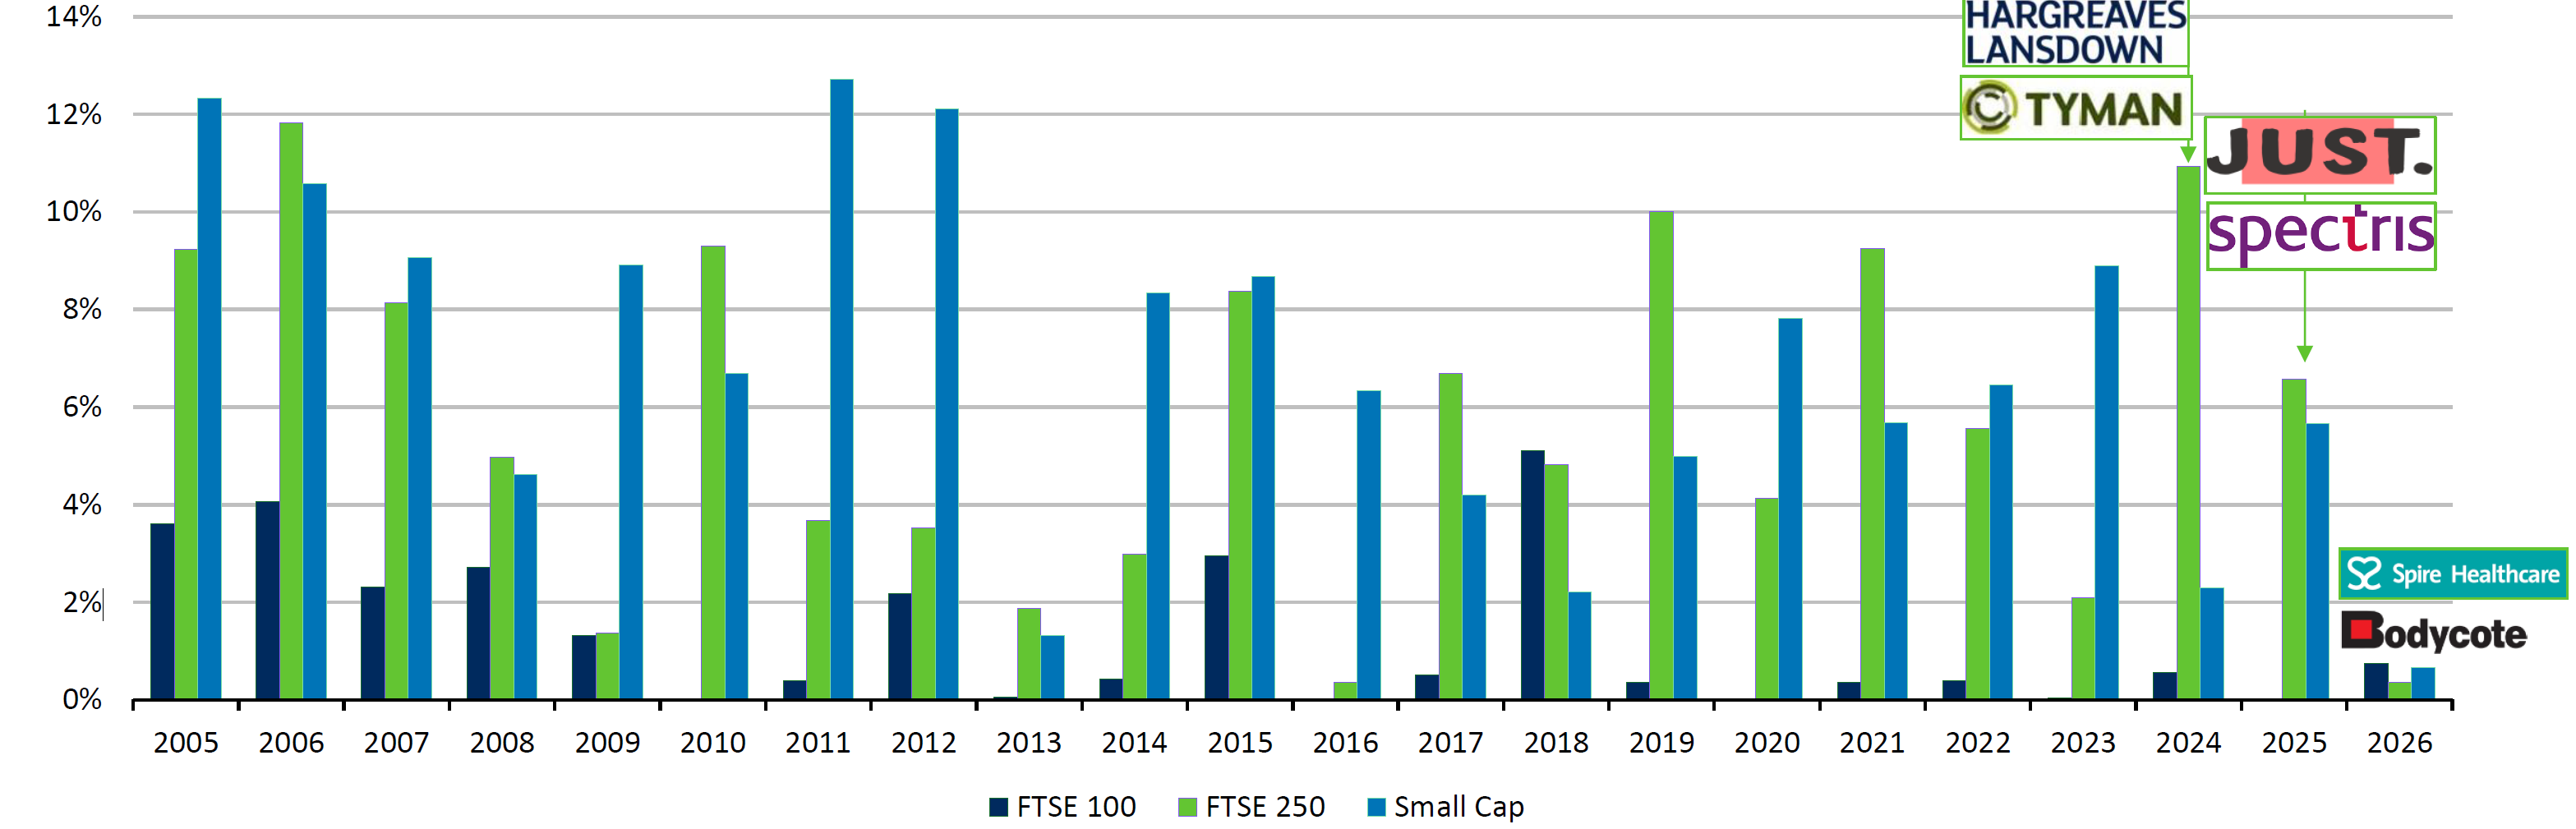
Source: Schroders, Panmure Liberum, 18 May 2026.
As such, Roche said there is “an embarrassment of riches” in terms of what investors can buy cheaply in the mid-sized market.
“We just look to buy the best communicators, the ones that provide the best insight into how they are managed,” she said.
However, given the high exposure to the domestic landscape that many of these companies have, Roche currently avoids companies in sectors where political risk dominates but still sees resilience in niche consumer areas, such as the defence sector as a technology play or companies providing access to high-protein products.
“House builders are the key example, as they are at GFC [great financial crisis of 2008] era valuations without the GFC-era balance sheets, so there is a case for holding some – but I don’t tend to be overly brave in sectors that are highly political.”
More broadly, when asked whether the rotation of multi-cap and large-cap managers into the FTSE 250 validates the opportunities in the mid-cap market or risks eroding the valuation discount, Roche was direct: “I’d say to them: come on in, the water’s warm.”
Troy's managers explain why a currency most investors avoid could be the portfolio's strongest diversifier.
Troy's Personal Assets Trust has lagged the market by a significant margin over the past year, but co-managers Sebastian Lyon and Charlotte Yonge believe the portfolio is better positioned than ever to weather the storms they see ahead.
The trust returned 6.3% in NAV terms for the year to 30 April 2026, against 25.2% from the FTSE All Share, a gap the managers describe as 'uninspiring' but largely expected given the trust's capital preservation mandate.
Personal Assets is designed to protect and then grow shareholders' capital. With 36% of the portfolio in equities at the year end and the rest spread across index-linked bonds, gold, cash and – unusually – Japanese yen, the trust is not built to chase a rising market.
The yen position is the most prominent addition to the portfolio, with Lyon and Yonge initiating a roughly 10% holding through short-dated Japanese government bonds in 2025 – the first time the trust has held the currency – on the expectation of sustained US dollar weakness.
“The Japanese currency is the cheapest it has been for four decades and the dollar has risen by 55% against the yen since 2020, moving well away from purchasing power parity,” they said. The holding has so far made a modest loss but Lyon and Yonge are not concerned.
The yen has historically strengthened in crises, as investors unwind yen-funded borrowings and repatriate capital. According to BCA Research, yen-denominated claims in overseas financial centres amount to around $650bn. When risk assets sell off, that capital tends to come home – and the yen strengthens.
“We believe the holding will provide us with good diversification and an offset, should stock markets become more risk-averse,” Lyon and Yonge said.
A weak yen is also deepening Japan's cost-of-living crisis and the managers see growing political pressure to address it. That adds a second potential route to yen strength, independent of global risk sentiment.
The case for holding the currency is also based on the view that markets are underpricing tail risk. They pointed to the Iran conflict as the fourth material supply shock of the decade, after the pandemic, the invasion of Ukraine and last year's tariffs. Central banks – already struggling to reach inflation targets – are now facing stagflation again and stretched government balance sheets leave little room for a fiscal response.
“Markets appear remarkably complacent about the threats posed from the conflict in the Gulf,” Lyon and Yonge said. “If the Strait of Hormuz is not reopened soon, the tail risk of a stagflationary outcome may become an inevitability.”
Speaking to Trustnet last month, Yonge said that if we get to August without oil supply resuming, there's “a very real chance of recession”.
Performance of fund against index and sector over 1yr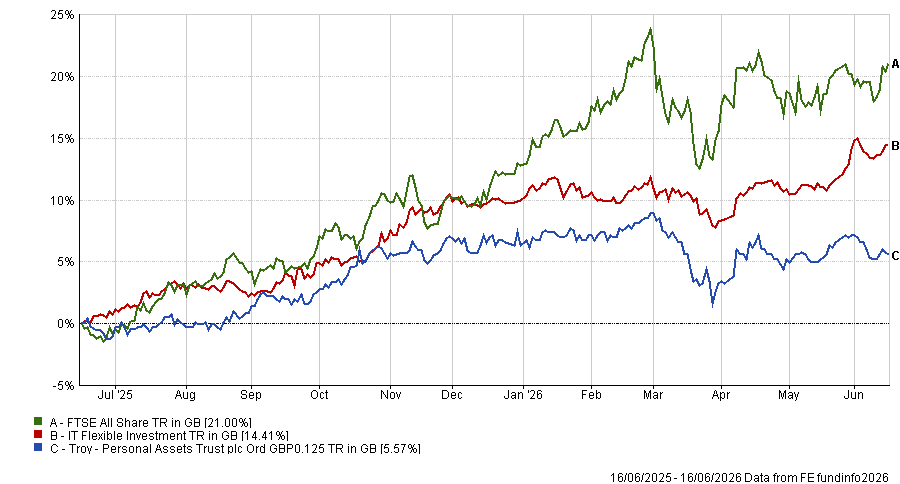
Source: FE Analytics
Against that backdrop, gold – held at 9% of the portfolio at year end – was up roughly 41% over the period and provided the bulk of returns outside equities for Personal Assets.
The equity sleeve, at around 36% of the portfolio, rose approximately 6% in aggregate. Alphabet, the trust's largest holding, rose 140% over the 12 months. Hubbell and Canadian National, both added during the year, rose 42% and 17% respectively. These gains were partly offset by sharp falls in Diageo and Experian, each down 27%.
The managers sold three positions during the period – American Express, Moody's and LVMH – and added Alcon, the eye care device company, alongside Hubbell and London Stock Exchange Group.
LSEG was flagged as one of the year's more interesting calls: the stock rallied from its February lows as the market came to appreciate the value of its proprietary datasets, which Lyon and Yonge argue AI will struggle to replicate.
AI is a thread running through the report. Lyon and Yonge described the market as moving fast to price in “unknowable change,” drawing a parallel with the internet boom of the late 1990s. They noted that following SpaceX, OpenAI and Anthropic are also expected to seek IPOs in the coming months, at valuations of $800bn and $1.3tn respectively – which they expect to sustain the pace of new model releases as those companies chase credible revenue streams.
Gold was reduced from 14% to 10% in January, when the price exceeded $5,100, on the grounds that purchasing behaviour had become “exuberant.” Lyon and Yonge remain positive on the position over the long term but trimmed on valuation grounds.
The board also agreed a revised fee structure with Troy, effective 1 May 2026, reducing the management fee on assets above £1.5bn from 0.45% to 0.35%.
UK mid- and small-cap fund manager Eustace Santa Barbara explains why Keir Starmer is potentially a more market-friendly choice than Andy Burnham.
It is “better the devil you know” when it comes to the UK government, according to Marlborough's Eustace Santa Barbara, who said it would be better for his investors if there was a political status quo rather than a leadership challenge.
This week is an important one for the Labour party. On Thursday 18 June, the Makerfield by-election could decide the future direction of the government.
Former Manchester mayor Andy Burnham is the Labour option on the ballot after ex-MP Josh Simons resigned so Burnham could run and, in turn, potentially take on Keir Starmer for the Labour leadership.
If Burnham wins, there is likely to be more uncertainty, something that markets notoriously dislike. This would impact Santa Barbara’s funds. He runs the IFSL Marlborough Special Situations portfolio, as well as two specialist small-cap funds.
This area of the market is more domestic-orientated and therefore can get buffeted around more by political instability.
“Starmer is doing a job. Rachel Reeves is doing a job. We, being the financial market, are sort of aware of what we're getting [with the current government],” he said. “For our unit holders, my suspicion is that the status quo would be a better outcome than Starmer losing.”
A Burnham challenge would add political instability. For starters, there are currently question marks over who would be his proposed chancellor.
“One of the front-runners, in terms of the betting, would be Yvette Cooper or Ed Milliband, who I would say holds some less market-friendly political and economic views,” the manager said.
That is not to say Santa Barbara is in lockstep with the current government either. He pointed out that there has been “some tinkering” and “rule breaking”, such as promising there would only be one painful, tax-hiking Budget.
“‘One and done’ suddenly became another tax-raising Budget,” the manager said, including recently foreshadowing that the Treasury may need raise more taxes to pay for defence spending and welfare increases.
“I'm [also] not exactly delighted by the lack of business experience on the front bench currently. I think that's a very obvious deficiency there. The lens from which they're looking at things is, shall we say, rather narrow? It does mean they're not great at thinking about consequences,” Santa Barbara noted.
Political instability is not new for UK investors, with the manager noting that it “hasn’t been a great decade” for political stability, with 2022 particularly “horrific”, with three prime ministers (Boris Johnson, Liz Truss and Rishi Sunak) and four chancellors (Sunak, Nadhim Zahawi, Kwasi Kwarteng and Jeremy Hunt).
It is by no means the only thing that has held UK smaller companies back in recent years. Indeed, IFSL Marlborough Special Situations has been one of the worst performers in the IA UK All Companies sector over the past five years, down 19.1%, as small-caps have struggled.
Performance of fund vs sectors over 5yrs
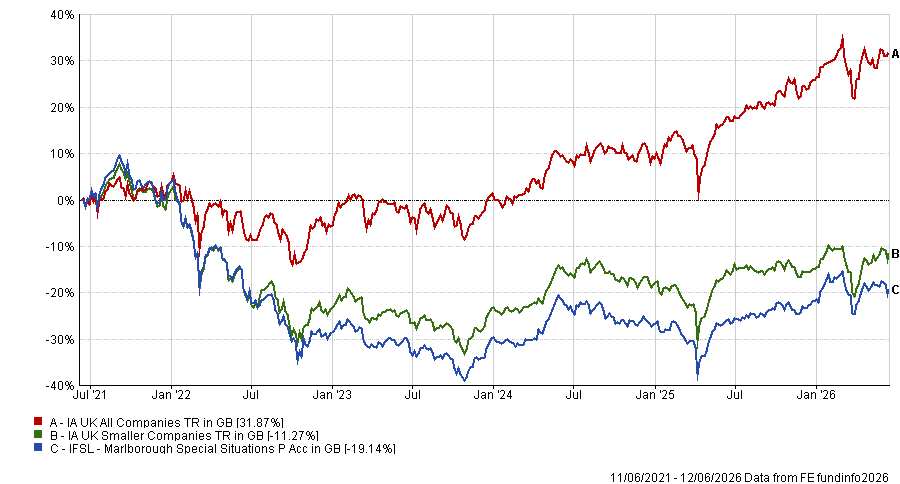
Source: FE Analytics
Yet the manager remains optimistic, noting that it is “darkest before dawn”. Although “the cheap can always get cheaper” when it comes to the UK market, there are some assumptions that he believes simply do not hold true.
The first is the prevailing view among markets that the UK has low or no GDP growth over the next three to five years, which leaves a lot of potential for the economy to surprise to the upside.
Another is capital flows into the lower portion of the market. UK funds have suffered outflows for years and much of the underperformance of the mid- and small-cap segment of the market has been due to investor selling, rather than inherently poor performance by the underlying companies, he noted.
There were signs this was reversing earlier in the year, when money started to enter this part of the market in January and February, before abruptly U-turning following the outbreak of the Iran war.
“Flows have probably had an exacerbating negative impact on our stocks. But I'm just not seeing the outflows we've seen in recent years, which is a genuinely positive thing. I don't know many managers in my space who are looking to sell,” said Santa Barbara.
While “we're still in the earlier contrarian phase in terms of people deploying capital into this space”, once one buyer emerges and small- and mid-cap companies get attention “they can move very quickly,” he said.
There are many structural changes in the world today, he says.
Europe has lurched from one crisis to the next since 2007, with Jean-Claude Trichet, former president of the European Central Bank, suggesting we are now living in a “permanent time of crisis”.
Crises can “come at any time without early warning”, he noted, with central banks stress-testing to ensure they can cope with any kind of new dramatic event.
“There are so many structural changes in the world today – not only economic and technical, but also AI and so forth. We will have a lot of shocks," he said.
“I myself have experienced, throughout my life, a succession of terrible shocks that we have forgotten today – the debt crisis of Latin America, Africa, the Soviet Union, Asia – [all] absolutely terrible [but] now forgotten. So be prepared for anything.”
It has not always been like this. Upon the inception of the euro in 1999, there was a period “without crisis” in which ECB policymakers had to undertake the “immense challenge of creating credibility and authority for a new currency that was starting from scratch”.
But since then, the world has moved from one crisis to another, the “most dramatic” of which was the permanent threat (and materialisation) of deflation during 10 years after the great financial crisis.
One of the most significant moves by central banks to bring stability has been an agreement to target inflation of 2% over the medium term. First set out by the ECB upon its inception in the late-90s, this was then followed by the UK and latterly by the US and Japan in 2012 and 2013 respectively.
As a result, it means the four major central banks of the major currencies – the dollar, euro, yen and sterling – have the same definition of price stability.
“This is something that is extremely important in my opinion and not taken sufficiently seriously by academia,” said Trichet.
“It seems to me that at the moment I'm speaking, it is remarkable: because since the explosion of Bretton Woods [in the 1970s], it is the most important and dramatic change in the international monetary system that we have had.
“That makes me a little bit more optimistic about our capacity, despite all the challenges, to maintain stability – both price stability and financial stability.”
Optimism was the key message from Trichet at the Amundi World Investment Forum, although the former ECB president noted that there are threats to the status quo.
For example, he agreed with former Federal Reserve of St Louis president James Bullard that it was imperative central banks’ 2% inflation target is maintained throughout the world.
“There was no negotiation in Basel that concluded that 2% was exactly what we needed. I trust that it is the case. It was decided independently by all the major central banks I mentioned. This is a major advance. We should keep that,” he said.
The other is that central bank independence “must be maintained”, despite pressures from governments to act in certain ways.
“The time horizon of governments is much shorter than the mandate of the central bank, so you have a permanent tension, which is normal, and that is the reason why there is such a strong consensus for central bank independence,” he said.
Franklin Templeton's Michael Browne revisits the case for UK assets a decade on, finding that corporate earnings have been more resilient than the political turmoil implied.
In 2016, whilst standing on the concourse of Victoria station just three days before the vote, a friend of mine close to the Remain camp called me. “I think we have lost it”. As someone who had worked and lived in London for three decades and who had recently decamped to Brighton, one of the rare Remain cities, I was shocked.
“Drive round Hampshire or Nottingham and Yorkshire and just look at the posters and the placards”, she said. David Cameron’s gamble to silence the anti-EU right was about to go radically wrong. As a European equity manager, the risks around an event such as this were so great meant I had little in the way of UK exposure anyway, and what little there was, was removed there and then.
The shockwave was immediate for the UK: the pound and the gilts market shuddered. Europe glitched. This was not supposed to happen. Merkel et al could not see this coming and thus had played hardball a few months earlier when Cameron had asked for concessions. How penny-wise and pound-foolish they now seemed.
This quickly hardened into a simple narrative, led by the French: let’s make this so unpleasant no one else will dare to do the same. They should not have worried, the Greeks had already made it clear five years earlier that leaving the euro was such a devastating blow to personal wealth that no electorate would ever consider it.
This ushered in the mess and muddle of the May years, during which she lost her majority, almost gave the keys to No 10 to the radical left, and resigned when she failed to pass almost anything through parliament, The factional fighting of the 2016-19 years may have critically undermined parliament as an institution.
The electorate then just wanted it done, and the landslide Johnson achieved was for just that. Lines that were red (no separate deal for Northern Ireland) evaporated and in early 2020, just before Covid, the UK floated off into the North Sea. Fishing rights were not much different, freedom of holidays (and work) was gone, a long tail of payments still existed, but the UK could set its own laws and do its own trade deals.
Then Covid struck.
Nothing happened. Not much could happen. Whatever momentum the UK could have gained, went. The US president changed, from sympathetic to hostile. Companies had to make it happen for themselves, coping with new regulations and losing margins more than markets. All the while, the actions of the PM and his ministers over Partygate so undermined his authority that Johnson was gone after just half his term in office.
Then it got worse, first under Truss and then under Sunak. Trust in politicians sank to new lows and I was at a UK conference in the Autumn 2022 when the CIO of a major UK insurance company declared that Brexit had made the UK uninvestable. She was not talking about the politics – no one would have forecast six prime ministers since the vote, with another on the way – she simply thought no one in the UK would make money if they invested in it having left the EU.
I was as shocked as I had been on Victoria station, because whilst there was all this political noise, companies had just got on with life. Earnings and EPS were ok. If I look at measures such as GDP growth both before and after Covid, they were pretty much in line with our European neighbours. There are plenty of erudite economic studies to show growth may have been worse than it would have been – hard to deny – but relative to our biggest trading partners across the channel, the UK did not materially under perform.
Covid and the invasion of Ukraine produced significant domestic volatility, much more in the UK than elsewhere when measured by inflation and growth, but the UK equity market, dominated by banks, pharmaceuticals, metals and miners, and oil stocks, performed well. Those international companies demonstrated their resilience. Even when you look at the mid-caps, the total return from across Europe between the UK, France and Germany, is in a narrow channel, whilst the UK may pay more in dividends.
It is in the bond markets where the radical changes have happened. The interest rate spread between 10-year UK gilts and German 10-year bunds, from the creation of the euro in 1999 to 2016, was mainly between zero and 80 bps. Post-2016, this began to rise; the old ceiling became a floor and this peaked at 2.24% just before last year’s Budget in October 2025.
This has become a major problem for the UK. The UK’s inflationary experience has been worse than that of Germany and, whilst German politics is in no great shape, its constitutional fiscal discipline has remained, maintaining credibility, whilst the UK embarked on its Covid and post-Covid fiscal spending spree which continues to this day. The competitiveness of the UK economy is being affected by much higher rates, and whilst savers may be happy, borrowers are not. These high rates of interest have led to huge savings surpluses being held in the banking system, in ISA or deposit accounts – but not invested. Good for bank profits, bad for housebuilders and innovators.
Wider measures are also interesting. Using metrics such as return on equity, return on assets, operating margin, net margin and return on invested capital, and looking at the UK equity market (MSCI UK) versus Germany, France, Italy, Spain and the eurozone: the UK market in 2016 ranked second, third, third, first and second. Today it ranks first, second, first, first and first. An all-round improvement.
What about AI, the new investment boom that has developed since Brexit? According to the Stanford AI Index, we can measure how private investment in AI in the UK fares compared with others. Over the 10 years to 2025, the UK saw more private investment in AI than Germany and France combined. The problem is that the UK’s credible $34bn is tiny compared to the $757bn the US has spent over the same period.
In those numbers lies the crux of the European problem, in or out of the EU, we have all missed the boat when it comes to AI. AI is a US invention, developed and rolled out in the US, which we will all need to subscribe to. There is no European Claude, or even Claudia. Future growth and employment rates will reflect this chasm between the two continents, with the risk that the best and brightest leave for the USA, as they did in the 19th century.
The outlook for relations between Europe and the UK has improved. Firstly, it helps that we all have a common problem in Russia and we are all part of NATO with a need to expand defence spending. There is a second common problem which is immigration and again some joint efforts are possible.
But this is piecemeal, a real rapprochement would need an explicit manifesto pledge, because the sovereignty argument remains the key one. In 2016 people voted against remote politicians running their lives badly. The politicians have become less remote, but their failures have come under intense scrutiny and disdain.
Following the 2024 vote for change the failure of the current administration to grow the economy, control immigration or get the NHS to function has left it friendless. This has driven the UK to undergo a political revolution, and we are watching the collapse of the old parties and rise of the new. This is the real impact of Brexit, and until that is settled, any question of returning to any cohabitation with Europe will be impossible.
After the Brexit vote, I thought that the precedent of the English Civil War would hold: the execution of the king in 1649 and the restoration of the monarchy in 1660. It would take a decade or so for the wounds to heal and the consideration of the benefits reversal. It turns out that things moved much faster in the 17th century than they do today.
Michael Browne is global investment strategist at the Franklin Templeton Institute. The views expressed above should not be taken as investment advice.
Markets have been volatile enough this year to rattle even experienced investors.
This year, returns have been heavily concentrated in a handful of AI-linked names – Nvidia, TSMC, SK Hynix – while funds that stuck to their process and avoided the crowded trades have lagged badly. Anyone sitting on losses is right to wonder whether they got anything wrong along the way but making hasty decisions while burned by the losses can scar even more.
The biases working against you
Three psychological traps worsen drawdowns, as Kartik Kumar, part of the investment team on the Aurora UK Alpha trust, recently told Trustnet.
Loss aversion makes investors oversensitive to risk signals. Anchoring fixes expectations on recent history rather than what's ahead. Career incentive pushes professionals toward the crowd, because being wrong alone is career-ending but being wrong together is acceptable.
Kumar also identified a fourth distortion: ‘the gap between the experiencing self and the remembering self’, whereby investors recall the peaks and troughs – the money made, the money lost – but they compress the time in between. Drawdown periods that lasted three years get mentally shortened.
It is, Kumar said, why people go on to have three or four children: they remember the sleepless nights of the first, but memory self-edits and compresses years of exhaustion into something more bearable than it actually was.
On Reddit's r/ukpersonalfinance, the same patterns appear in retail form: checking portfolios daily, feeling physically sick at the red numbers and an urge to sell to stop the pain.
One user, down 30% after putting half a £70,000 stocks and shares ISA into crypto exchange-traded funds (ETFs), described wanting to move to a higher-paying job just to cover the loss. The replies he got from other users were not advocating portfolio action but a change of behaviour, with the most upvoted response saying to delete the trading app.
Tom Stevenson, investment director at Fidelity International, backed staying put with maths.
A £100 investment in the FTSE 100 at the end of 1991, with dividends reinvested, would have grown to £1,500 by February this year. Miss the best 10 days over that period and the pot halves to £750. Miss the best 20 days and it falls to £470.
The problem is that in volatile markets, the best and worst days cluster together – so an investor who gets out to avoid the falls will almost certainly miss the rebounds too.
How professionals handle it
The instinct to act – to sell, to switch, to do anything – is understandable. The question is how to override it with something more rigorous and professional investors often build this into their process.
Ben Mackie, senior fund manager at Hawksmoor, starts looking at his losses when they happen with scepticism.
“Our first assumption isn't ‘this is a buying opportunity’. The market is often efficient,” he said. “So we return to the investment thesis, we interrogate the manager, before seeking to take any trading activity.”
The central question is what caused the fall: sentiment (investors applying a lower multiple to the same earnings stream, with the underlying fundamentals intact) or a genuine deterioration in what the business or portfolio can produce.
“Where the drawdown has been driven by a de-rating and the fundamentals haven't deteriorated, that's when we start thinking this drawdown is an opportunity,” he said.
To be able to analyse that, Hawksmoor uses a written template. When a holding is bought, the team documents the investment thesis under four headings: valuation, fundamentals, manager quality and what the position contributes to the portfolio. When something goes wrong, they return to that document.
“Decomposing the investment thesis into those categories means we can be a bit more granular in identifying where there've been problems,” Mackie said.
The manager question
Knowing whether to hold also means knowing whether the manager is the problem. Mackie separated two situations that investors often conflate: a manager whose process has broken and a manager whose style is simply out of favour.
The current environment is a test of that. Funds without exposure to AI infrastructure stocks – Nvidia, TSMC and their peers – have had a hard time keeping up with indices that have become increasingly concentrated in those names but that is not evidence of failure.
“They're really sticking to their knitting but don't have the go-go stocks of the day,” said Mackie, who will be patient with those managers.
What would concern him is the opposite: a manager who abandons their process to chase what is working. “That would be a much bigger red flag for us than a portfolio that's drawn down because sentiment is against that particular part of the market,” he said.
Valuation discipline, Mackie argued, is also the best defence against buying something at the wrong point in its cycle. By late 2021, quality-growth funds – Fundsmith Equity, Finsbury Growth & Income, Evenlode Income – had re-rated sharply.
Hawksmoor had zero exposure not because of a view on those managers' ability but because the valuations no longer offered a margin of safety. When rates rose in 2022, those funds de-rated.
Hawksmoor has recently started adding some exposure back, including Castlebay UK Equity and Evenlode Income, because the portfolios now trade on their highest free cash flow yield in the funds’ history.
When to sell
The hardest decision is admitting the thesis was wrong. Mackie's answer to the behavioural problem – the inability to sell at a loss – is humility. A hit rate of 55% is, he said, what a very good active manager achieves. That means 45% of calls are wrong.
“That humility and acceptance – and the empirical evidence supports this – that you're not going to get everything right, makes it easier to actually say we got this wrong and we need to move on,” he said.
Keeping a pipeline of ideas helps too. If there is always something on the bench competing for capital, the decision to exit a losing position becomes about deploying money into something better, rather than just crystallising a loss.
Kumar's version of the same discipline is to anchor to intrinsic value rather than price. If an investor knows what something is worth – not what it costs, but what the underlying assets or earnings actually represent – then they are able to reframe a price fall in their head.
He used Frasers as an example: £20,000 of shares currently buys around £48,000 worth of underlying assets and wealth, by his estimate. That reframing does not eliminate the pain but it changes what the pain means.
The information contained within this website is provided by Allfunds Digital, S.L.U. acting through its business division Digital Look Ltd unless otherwise stated. The information is not intended to be advice or a recommendation to buy, sell or hold any of the shares, companies or investment vehicles mentioned, nor is it information meant to be a research recommendation. This is a solution powered by Allfunds Digital, S.L.U. acting through its business division Digital Look Ltd incorporating their prices, data news, charts, fundamentals and investor tools on this site. Terms and conditions apply. Prices and trades are provided by Allfunds Digital, S.L.U. acting through its business division Digital Look Ltd and are delayed by at least 15 minutes.
© 2026 Refinitiv, an LSEG business. All rights reserved.
 Please wait...
Barclays Investment Solutions Limited provides wealth and investment products and services (including the Smart Investor investment services) and is authorised and regulated by the Financial Conduct Authority and is a member of the London Stock Exchange and NEX. Registered in England. Registered No. 2752982. Registered Office: 1 Churchill Place, London E14 5HP.
Barclays Bank UK PLC provides banking services to its customers and is authorised by the Prudential Regulation Authority and regulated by the Financial Conduct Authority and the Prudential Regulation Authority (Financial Services Register No. 759676). Registered in England. Registered No. 9740322. Registered Office: 1 Churchill Place, London E14 5HP.